
- Title
-
Genomic, cDNA, and embryonic expression analysis of zebrafish transforming growth factor beta 3 (tgfbeta3)
- Authors
- Cheah, F.S., Jabs, E.W., and Chong, S.S.
- Source
- Full text @ Dev. Dyn.
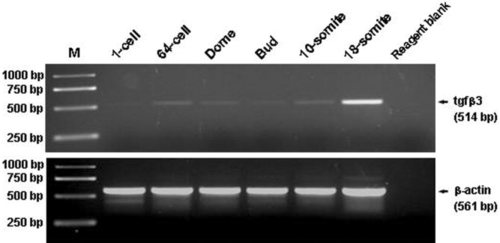
Reverse transcription-polymerase chain reaction analysis of tgfΒ3 expression in the developing zebrafish embryo. Upper panel, tgf Β3 transcript; lower panel, Β-actin transcript (internal control). M, GeneRuler 1-kb DNA ladder (Fermentas). EXPRESSION / LABELING:
|
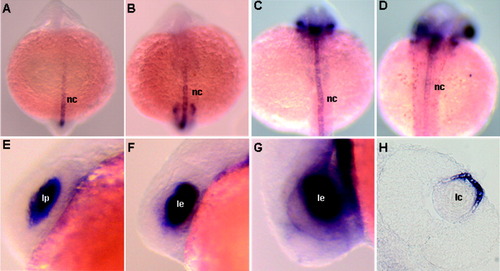
Zebrafish tgfΒ3 expression in the notochord (A-D) and lens (E-H). Dorsal (A-D), lateral (E-G), and coronal section (H) views are shown. A: At the 10-somite stage, weak but distinct expression of tgfΒ3 is observed in the notochord. B,C: This expression increases in intensity from the 14-somite (B) to 26 somite (C) stage. D: Expression in the notochord begins to decrease from the prim-5 stage onward. E: TgfΒ3 transcripts are detected in the lens primordium at the 21-somite stage. F,G: Expression is stronger at the 26 somite (F) and prim-5 (G) stages. H: By the pec-fin stage, expression is restricted to the outer lens cells. nc, notochord; lp, lens primordium; le, lens; lc, lens core. EXPRESSION / LABELING:
|
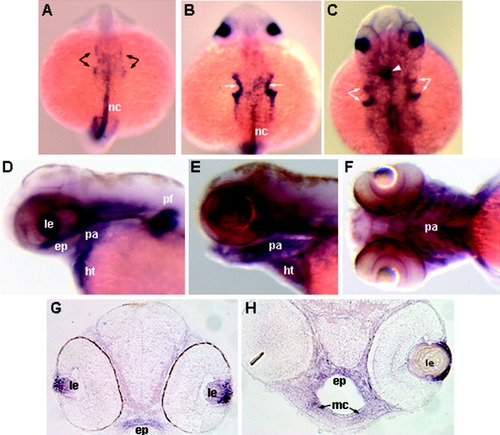
Zebrafish tgfΒ3 expression in the presumptive pharyngeal arch primordia, pharyngeal arches, and neurocranial cartilage. Dorsal (A-C), lateral (D,E), ventral (F), and coronal section (G,H) views are shown. A: Expression of tgfΒ3 transcripts in the pharyngeal arch primordial region (arrows) starts around the 18-somite stage. B,C: This expression (arrows) intensifies at the 26-somite and prim-5 stages. Arrowhead in C indicates location of the heart tube. D: At the long-pec stage, transcripts are expressed in the pharyngeal arch region and ethmoid plate. E,F: At the protruding mouth stage, weak expression is observed in all the pharyngeal arches. G,H: Tissue analysis of the long-pec and pec-fin stages, respectively, showing expression in the ethmoid plate and Meckel′s cartilage (arrows). ep, ethmoid plate; ht, heart; le, lens; mc, Meckel′s cartilage; nc, notochord; pa, pharyngeal arches; pf, pectoral fin. EXPRESSION / LABELING:
|
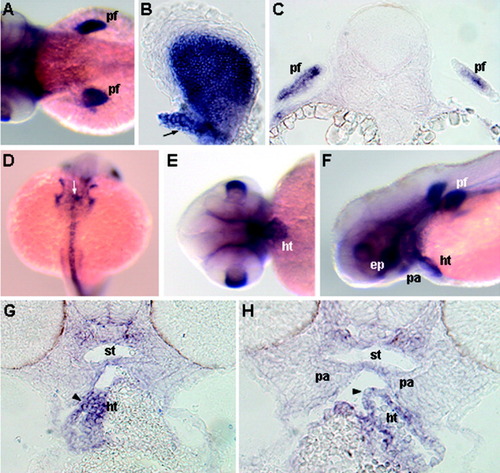
Zebrafish tgfΒ3 expression in the pectoral fins (A-C,F) and heart (D-H). Dorsal (A,D), lateral (F), ventral (E), flat-mount (B), transverse section (C), and coronal section (G,H) views are shown. A,B: At the long-pec stage, tgfΒ3 transcripts are expressed in the pectoral fin and its base (arrow in B). C: Pec-fin stage embryo, showing localization of transcripts in the precartilage core of the pectoral fin bud. D: At the 21-somite stage, transcripts are detected in the fusing cardiac progenitors (arrow). E,F: At the high-pec and long-pec stages, respectively, tgfΒ3 is expressed in the entire heart. G,H: Sections from a long-pec stage embryo, revealing transcript staining in the entire myocardium (arrowheads). ep, ethmoid plate; ht, heart; pa, pharyngeal arches; pf, pectoral fin; st, stomodeum. EXPRESSION / LABELING:
|

Unillustrated author statements EXPRESSION / LABELING:
|