|
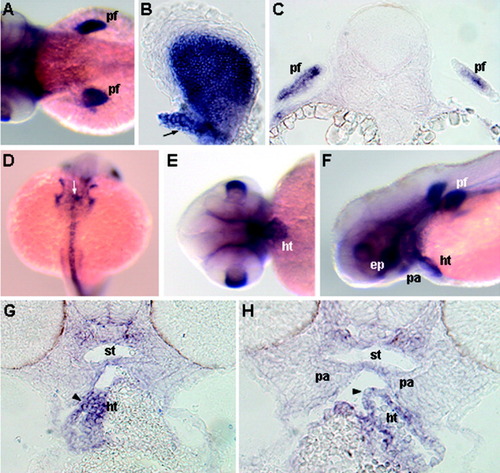
Zebrafish tgfΒ3 expression in the pectoral fins (A-C,F) and heart (D-H). Dorsal (A,D), lateral (F), ventral (E), flat-mount (B), transverse section (C), and coronal section (G,H) views are shown. A,B: At the long-pec stage, tgfΒ3 transcripts are expressed in the pectoral fin and its base (arrow in B). C: Pec-fin stage embryo, showing localization of transcripts in the precartilage core of the pectoral fin bud. D: At the 21-somite stage, transcripts are detected in the fusing cardiac progenitors (arrow). E,F: At the high-pec and long-pec stages, respectively, tgfΒ3 is expressed in the entire heart. G,H: Sections from a long-pec stage embryo, revealing transcript staining in the entire myocardium (arrowheads). ep, ethmoid plate; ht, heart; pa, pharyngeal arches; pf, pectoral fin; st, stomodeum.
|