
FIGURE
Fig. 4
- ID
- ZDB-FIG-050422-2
- Publication
- Cheah et al., 2005 - Genomic, cDNA, and embryonic expression analysis of zebrafish transforming growth factor beta 3 (tgfbeta3)
- Other Figures
- All Figure Page
- Back to All Figure Page
Fig. 4
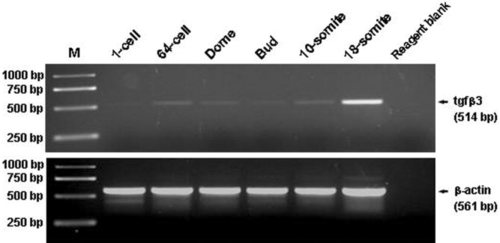
Reverse transcription-polymerase chain reaction analysis of tgfΒ3 expression in the developing zebrafish embryo. Upper panel, tgf Β3 transcript; lower panel, Β-actin transcript (internal control). M, GeneRuler 1-kb DNA ladder (Fermentas). |
Expression Data
| Gene: | |
|---|---|
| Fish: | |
| Anatomical Term: | |
| Stage Range: | 1-cell to 14-19 somites |
Expression Detail
Antibody Labeling
Phenotype Data
Phenotype Detail
Acknowledgments
This image is the copyrighted work of the attributed author or publisher, and
ZFIN has permission only to display this image to its users.
Additional permissions should be obtained from the applicable author or publisher of the image.
Full text @ Dev. Dyn.