|
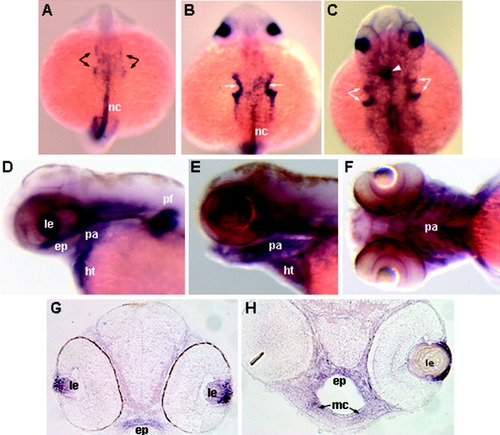
Zebrafish tgfΒ3 expression in the presumptive pharyngeal arch primordia, pharyngeal arches, and neurocranial cartilage. Dorsal (A-C), lateral (D,E), ventral (F), and coronal section (G,H) views are shown. A: Expression of tgfΒ3 transcripts in the pharyngeal arch primordial region (arrows) starts around the 18-somite stage. B,C: This expression (arrows) intensifies at the 26-somite and prim-5 stages. Arrowhead in C indicates location of the heart tube. D: At the long-pec stage, transcripts are expressed in the pharyngeal arch region and ethmoid plate. E,F: At the protruding mouth stage, weak expression is observed in all the pharyngeal arches. G,H: Tissue analysis of the long-pec and pec-fin stages, respectively, showing expression in the ethmoid plate and Meckel′s cartilage (arrows). ep, ethmoid plate; ht, heart; le, lens; mc, Meckel′s cartilage; nc, notochord; pa, pharyngeal arches; pf, pectoral fin.
|