
Image
|
Figure Caption
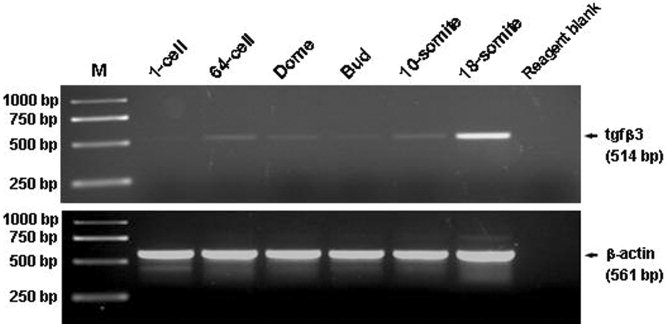
Fig. 4
Reverse transcription-polymerase chain reaction analysis of tgfΒ3 expression in the developing zebrafish embryo. Upper panel, tgf Β3 transcript; lower panel, Β-actin transcript (internal control). M, GeneRuler 1-kb DNA ladder (Fermentas).
Figure Data
Acknowledgments
This image is the copyrighted work of the attributed author or publisher, and
ZFIN has permission only to display this image to its users.
Additional permissions should be obtained from the applicable author or publisher of the image.
Full text @ Dev. Dyn.