
|
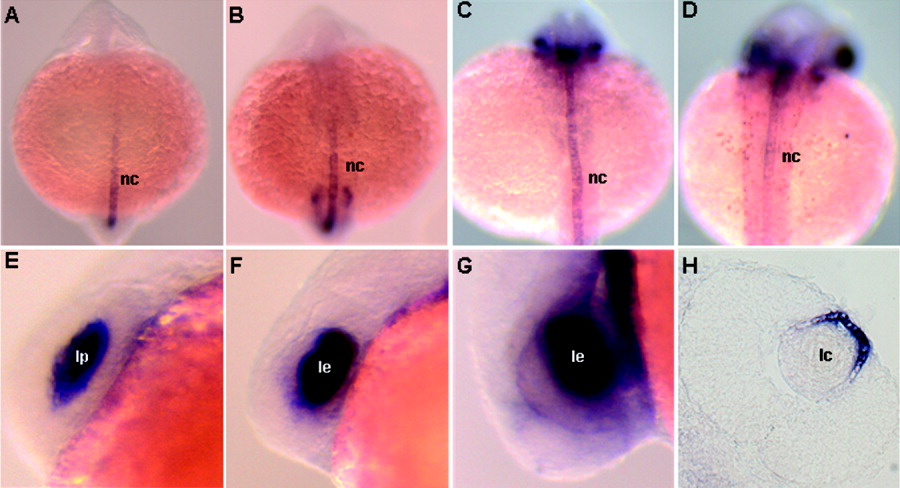
Fig. 5 Zebrafish tgfΒ3 expression in the notochord (A-D) and lens (E-H). Dorsal (A-D), lateral (E-G), and coronal section (H) views are shown. A: At the 10-somite stage, weak but distinct expression of tgfΒ3 is observed in the notochord. B,C: This expression increases in intensity from the 14-somite (B) to 26 somite (C) stage. D: Expression in the notochord begins to decrease from the prim-5 stage onward. E: TgfΒ3 transcripts are detected in the lens primordium at the 21-somite stage. F,G: Expression is stronger at the 26 somite (F) and prim-5 (G) stages. H: By the pec-fin stage, expression is restricted to the outer lens cells. nc, notochord; lp, lens primordium; le, lens; lc, lens core.