
- Title
-
Retinoic acid-mediated gene expression in transgenic reporter zebrafish
- Authors
- Perz-Edwards, A., Hardison, N.L., and Linney, E.
- Source
- Full text @ Dev. Biol.
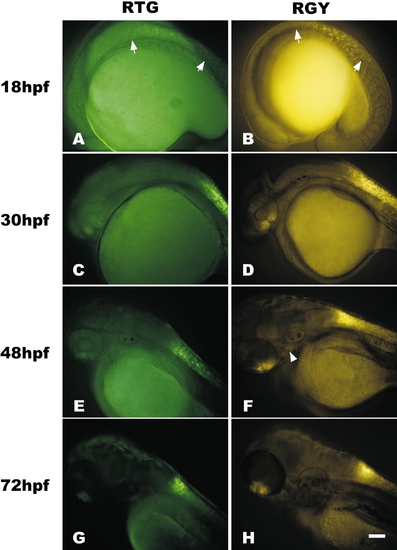
Time course comparison of fluorescent protein expression in transgenic lines that utilize different minimal promoters and fluorescent reporter genes. (A and B) Eighteen-somite stage (18 hpf) RTGn3 (A) and RGYn2 (B) embryos have neural tube expression, extending from just anterior to somite 1 to about somite 8 (arrows). RGY lines have additional expression in the underlying notochord. (C and D) At 30 hpf neural tube expression extends anteriorly into the caudal hindbrain and is initiated weakly in the dorsal retina and strongly in the ventral retina. (E and F) By 48 hpf, expression continues to strengthen in the retina and neural tube. Expression in the neural tube of RTG lines is less dense than in RGY lines. RGY also has weak expression in branchial arches (arrowhead). (G and H) By 72 hpf neural tube expression has retreated from the hindbrain and tail, leaving a region of strong expression in the spinal cord adjacent to the pectoral fins. Embryos and larvae are oriented with rostral left and dorsal up and photographs are bright-field/fluorescent overlays. Exposure times for fluorescent images were 5 s for A–D, 1.5 s for E and F, and 0.5 s for G and H. Bar, 100 μm. RTG embryos were larger than RGY embryos. |
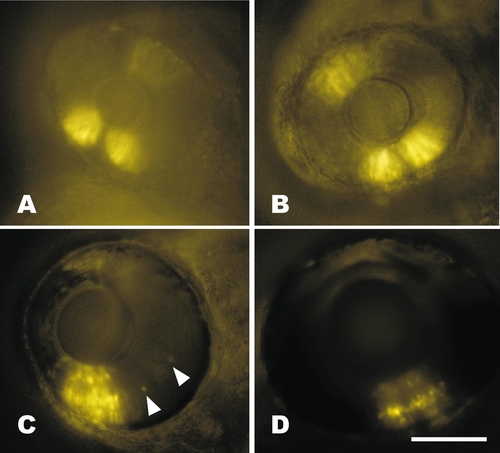
Time course of retinal expression in RGYn2. (A) Expression in the ventral retina patch is broader and stronger at 30 hpf than dorsal. Exposure time was 1 s. (B) Expression continues in similar dorsal and ventral patches by 48 hpf, but is much stronger. Exposure time was 0.25 s. (C) By 72 hpf the neural retina has differentiated into three distinct layers, all of which have transgene expression in RGY lines. A few expressing cells outside the ventral patch are visible in the inner nuclear layer (arrowheads). The dorsal retina is out of focus, but continues weak expression at this time. Exposure time was 0.1 s. (D) The layered expression continues in the ventral retina at 5 days postfertilization and occurs primarily in the inner and outer nuclear layers of the dorsal retina (out of focus). Exposure time was 0.5 s. Bar, 100 μm. All fish are oriented with rostral left and dorsal up. |
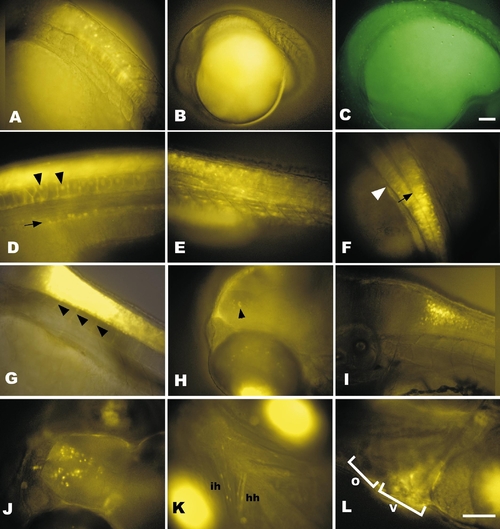
RGY expression patterns are more complex than RTG expression. (A) Notochord and neural tube expression in RGY at 18 hpf is in a subset of cells in each tissue. (B and C) Fluorescent images of nontransgenic embryos at 18 hpf to demonstrate typical autofluorescence when using long exposure times required to capture early transgene expression shown in Figs. 2A and 2B with yellow (B) or green (C) filter sets. Exposure times were 5 s. (D–F) Transgene expression in 30 hpf RGY embryos in the pronephric ducts (arrow) and vacuolated notochord (arrowheads) at the level of the junction between yolk and yolk extension (D). Expression also occurs in the somites (E). In the neural tube (shown in dorsal view in F) expression extends rostrally into the caudal hindbrain beyond the posterior tip of the hindbrain ventricle (black arrow) and first myotome (white arrowhead). (G) At 48 hpf neural tube expression extends ventrally in axon-like projections to the somites (arrowheads). (H) Dorsolateral view of rostral end of 72 hpf RGY larvae showing an arch of expression in cells of the inner nuclear layer of the dorsal retina and a small patch of forebrain expression (arrowhead). Bright fluorescence at the bottom of the image is the ventral retina. (I) Lateral view of 72-hpf hindbrain/spinal cord junction imaged as a confocal slice shows higher density of dorsal cells expressing the transgene than ventral. (J) Dorsal view of expression in the forebrain at 5 days postfertilization. (K) Ventral view of transgene expression in cranial skeletal muscles, hyohyoideus (hh) and interhyodoideus (ih). Bright bilateral fluorescence is expression in the ventral retina. (L) Lateral view of 5-day heart showing blurred expression in the beating ventricle (V) that is excluded from the outflow tract (O). A–E, G–I, and L are lateral views with rostral left and dorsal up. F is a dorsal view with rostral up. J and K are dorsal and ventral views, respectively, with rostral left. Bars, 100 μm. Scale for A and D–K is the same as in L. Scale for B is same as in C. |
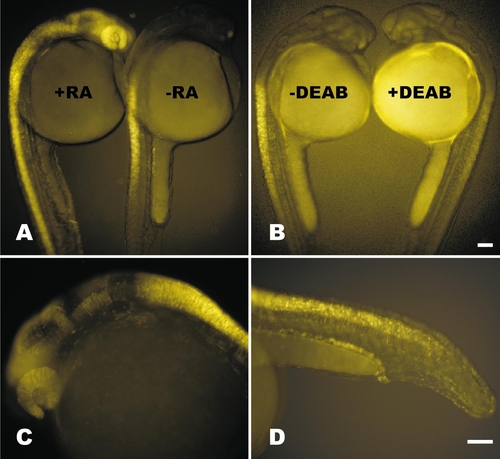
Transgene signal is RA inducible and dependent. (A) Treatment of embryos with 1 μM RA at 18 hpf induces transgene expression throughout the neural tube and neural retina by 24 hpf (+RA, left) compared to an ethanol-treated control (-RA, right). (B) Treatment of embryos with 10 μM DEAB, an RA synthase inhibitor, at 18 hpf significantly reduces transgene signal in the neural tube and abolishes it in all other regions of expression by 24 hpf (+DEAB, right) compared to DMSO-treated control (-DEAB, left). (C) Expression in the anterior nervous system responds to RA induction at varying levels when treated with 0.1 μM RA at 18 hpf. (D) Details of posterior induction, including the pronephric ducts, immature notochord cells, neural tube, and enveloping layer when embryos are treated at 1 μM RA at 18 hpf. Bars, 100 μm. Scale for A is same as in B. Scale for C is same as in D. |
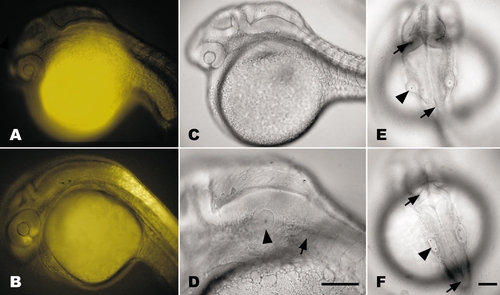
DEAB treatment at gastrulation abolishes transgene signal and teratogenizes zebrafish embryos by 24 hpf. (A) Treatment of transgenic embryo (RGYn2) with10 μM DEAB at shield stage (6 hpf) completely abolishes YFP expression by 24 hpf compared to DMSO-treated control (B). (C) DEAB treatment reduces frontonasal region, retina, hindbrain, and otic vesicle while inhibiting development of heart tube and fin bud. (D) Lateral view of the hindbrain demonstrates the significant reduction in the distance between the otic vesicle (arrowhead) and first myotome (arrow) in DEAB-treated embryo. (E and F) Dorsal views of DEAB-treated (E) and DMSO-treated (F) embryos demonstrate that the hindbrain is slightly reduced between the isthmus (top arrows) and the otic vesicles (arrowheads) while the caudal hindbrain between the otic vesicle and the termination of the ventricle (bottom arrows) is significantly reduced. The overall width of the hindbrain is also increased as a result of DEAB treatment. All embryos are oriented with rostral left and dorsal up, except for dorsal views in E and F, which have rostral up. Bars, 100 μm. Scale for A–C and E is the same as F. |
Reprinted from Developmental Biology, 229(1), Perz-Edwards, A., Hardison, N.L., and Linney, E., Retinoic acid-mediated gene expression in transgenic reporter zebrafish, 89-101, Copyright (2001) with permission from Elsevier. Full text @ Dev. Biol.