
Fig. 2
- ID
- ZDB-FIG-080514-19
- Publication
- Perz-Edwards et al., 2001 - Retinoic acid-mediated gene expression in transgenic reporter zebrafish
- Other Figures
- All Figure Page
- Back to All Figure Page
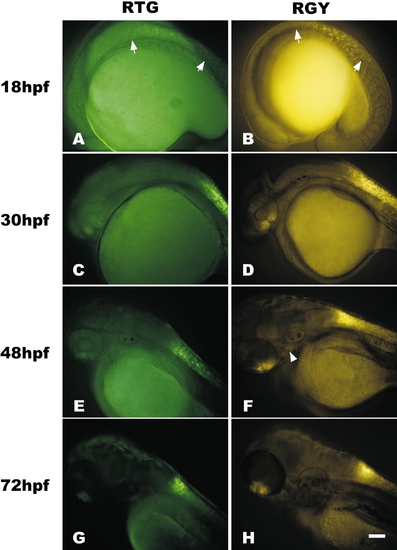
Time course comparison of fluorescent protein expression in transgenic lines that utilize different minimal promoters and fluorescent reporter genes. (A and B) Eighteen-somite stage (18 hpf) RTGn3 (A) and RGYn2 (B) embryos have neural tube expression, extending from just anterior to somite 1 to about somite 8 (arrows). RGY lines have additional expression in the underlying notochord. (C and D) At 30 hpf neural tube expression extends anteriorly into the caudal hindbrain and is initiated weakly in the dorsal retina and strongly in the ventral retina. (E and F) By 48 hpf, expression continues to strengthen in the retina and neural tube. Expression in the neural tube of RTG lines is less dense than in RGY lines. RGY also has weak expression in branchial arches (arrowhead). (G and H) By 72 hpf neural tube expression has retreated from the hindbrain and tail, leaving a region of strong expression in the spinal cord adjacent to the pectoral fins. Embryos and larvae are oriented with rostral left and dorsal up and photographs are bright-field/fluorescent overlays. Exposure times for fluorescent images were 5 s for A–D, 1.5 s for E and F, and 0.5 s for G and H. Bar, 100 μm. RTG embryos were larger than RGY embryos. |
Reprinted from Developmental Biology, 229(1), Perz-Edwards, A., Hardison, N.L., and Linney, E., Retinoic acid-mediated gene expression in transgenic reporter zebrafish, 89-101, Copyright (2001) with permission from Elsevier. Full text @ Dev. Biol.