
- Title
-
Quantification of Idua Enzymatic Activity Combined with Observation of Phenotypic Change in Zebrafish Embryos Provide a Preliminary Assessment of Mutated idua Correlated with Mucopolysaccharidosis Type I
- Authors
- Lin, C.Y., Lin, H.Y., Chuang, C.K., Zhang, P.H., Tu, Y.R., Lin, S.P., Tsai, H.J.
- Source
- Full text @ J Pers Med
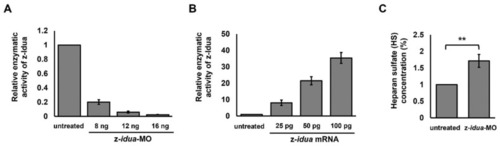
Both z-Idua enzymatic activity and the accumulation of heparan sulfate (HS) in zebrafish embryos were closely correlated with knockdown or overexpression of z- |
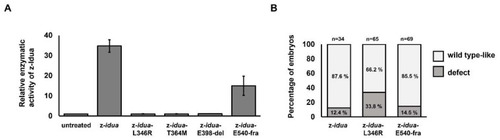
The z-Idua enzymatic activity and occurrence of defective phenotypes in zebrafish embryos was impacted by injection of mutated z- |
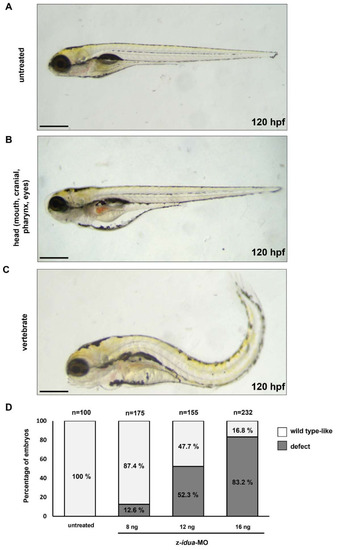
Knockdown of z- |
Knockdown of z- |
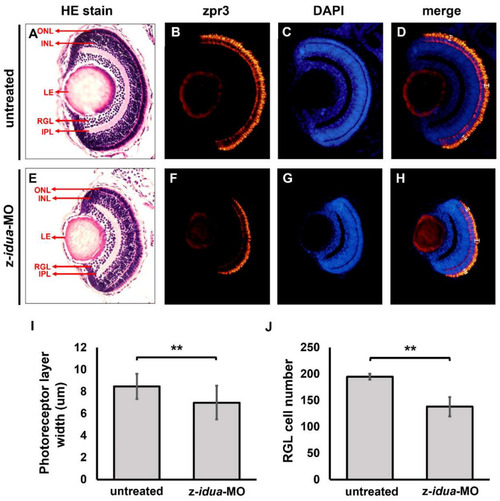
Knockdown of z- |