
- Title
-
Cerebroventricular Injection of Pgk1 Attenuates MPTP-Induced Neuronal Toxicity in Dopaminergic Cells in Zebrafish Brain in a Glycolysis-Independent Manner
- Authors
- Lin, C.Y., Tseng, H.C., Chu, Y.R., Wu, C.L., Zhang, P.H., Tsai, H.J.
- Source
- Full text @ Int. J. Mol. Sci.
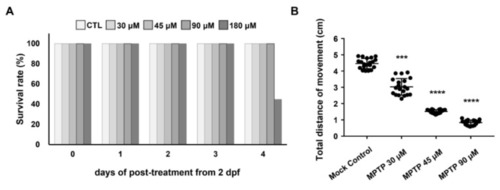
Figure 1. Effect of different concentrations of MPTP on the survival rate and swimming ability of zebrafish larvae. (A) The daily post-treatment survival rate of embryos immersed with different concentrations of MPTP, as indicated, starting at 2 dpf for 4 days. (B) Statistical analysis of the total swimming distance of larvae treated with different concentrations of MPTP as indicated. Larvae cultured in a 3 cm dish and treated with DMSO served as a mock control. The total distance (in cm) of a single larva was the sum of its swimming distance instigated by touches to the head and was averaged from three trials. The total distance of each experiment was the average total distance obtained from 20 larvae, while that of each group was averaged from three independent experiments. Student’s t-test was used to determine significant differences between each group (****, p < 0.0001; ***, p < 0.001).
|
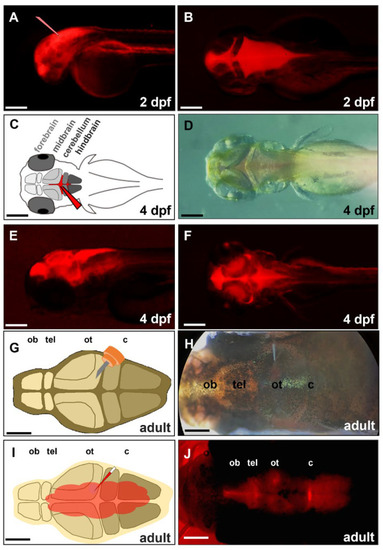
Figure 2. Distribution of the injected exogenous DsRed protein in brain chamber. We injected exogenous red fluorescence protein (DsRed) into the brain chamber of a zebrafish embryo at (A,B) 2-, (C–F) 4-dpf, and (G–J) a 6-month-old adult zebrafish. (A) The glass needle represents the injection site of zebrafish embryo’s head at 2 dpf. (C) Schematic diagram depicts the direct injection of DsRed into the brain chamber of zebrafish embryo at 4 dpf. The glass needle marked in red represents the injection site. (D) Dorsal view of 4-dpf embryo injected with DsRed under bright-field microscopy; (E) Lateral view of 4-dpf embryo injected DsRed under fluorescence microscopy; (F) Dorsal view of 4-dpf embryo injected DsRed under fluorescence microscopy. (G) Schematic diagram depicts a small incision that was generated above the optic tectum of adult zebrafish by a 30-gauge syringe. (H) Dorsal view of adult zebrafish injected DsRed by glass needle under bright-field microscopy; (I) Schematic diagram depicts the distribution of injected DsRed in the brain through the cerebroventricular fluid. (J) Dorsal view of adult zebrafish injected DsRed after 30 min under fluorescence microscopy. ob: olfactory bulb, tel: telencephalon, ot: optic tectum, c: cerebellum. Scale bar: (A–F) 25 µm; (G–J) 500 µm.
|
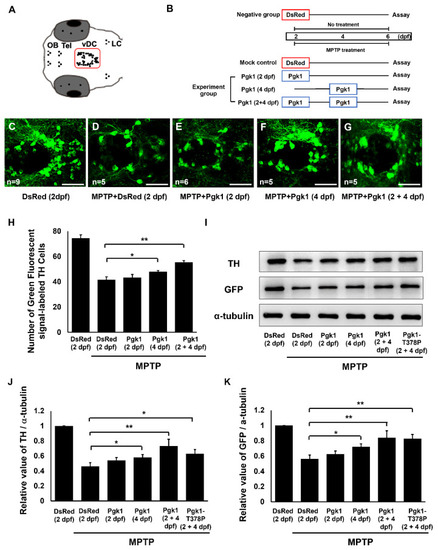
Figure 3. Direct injection of Pgk1 into the brain chamber prevents MPTP-induced dopaminergic cell death in the ventral diencephalon of zebrafish embryo at 6 dpf. (A) Schematic diagram depicts the distribution of dopaminergic neuronal cells in the brain of zebrafish embryo. The vDC region is marked with a square. (B) Schedule of MPTP treatment for embryos from 2 to 6 dpf. Negative control: embryos were injected with DsRed protein at 2 dpf without MPTP treatment. Mock control: embryos were injected with DsRed protein at 2 dpf and treated with 45 µM MPTP from 2 through 6 dpf. Experimental groups: Pgk1 was individually injected at 2, 4, and 2 plus 4 (2 + 4) dpf and then treated with MPTP from 2 to 6 dpf. Immunostaining assay was performed at 6 dpf. (C–G) Immunostaining of zebrafish embryos at 6 dpf. Using confocal microscopy, Tyrosine hydroxylase (TH)-specific antibody, labeled with a green fluorescence signal, could be observed in the vDC region of embryos with different treatments, as indicated. (H) Statistical analysis of the average number of the green fluorescent signal-labeled TH cells located in vDC. Number of examined embryos was indicated at the lower left corner of each panel. Projections of Z-stack images were generated with 2 µm. (I) Western blot analysis of the TH and GFP proteins expressed in the head of 10 larvae from transgenic line Tg(dat:EGFP) treated as indicated. The α-tubulin served as an internal control. The relative expression values of (J) TH and (K) GFP quantified from different groups after normalization of the expression level of α-tubulin. The level of each examined protein in the negative group set was expressed as 1. All data were averaged from three independent experiments and represented as mean ± S.D. Student’s t-test was used to determine significant differences between each group (**, p < 0.01; *, p < 0.05). OB: olfactory bulb; Tel: telencephalon; vDC: ventral diencephalon; LC: locus coeruleus. Scale bar, 50 μm.
|
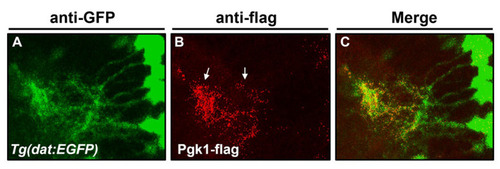
The injected Pgk1 was located at the surface of dopamine cells in the brain chamber. Using immunofluorescent staining to detect the spatial distribution of dopamine neurons and the location of injected Pgk1 in the zebrafish embryos at 4 dpf. ( |
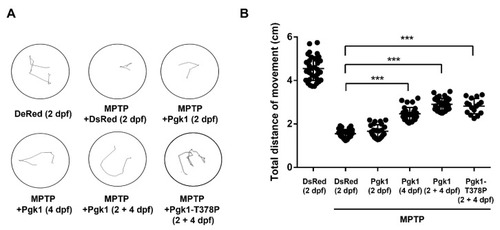
Figure 5. Injection of recombinant Pgk1-Flag into the brain could partially rescue the impairment of swimming performance of MPTP-induced zebrafish larvae. Six groups of zebrafish larvae at 6 dpf, as indicated, were categorized: (1) DsRed (2dpf): embryos at 2 dpf were injected with DsRed protein without MPTP treatment and served as a negative control; (2) MPTP + DsRed (2dpf): embryos at 2 dpf were injected with DsRed protein and treated with MPTP as a mock control; (3–5) Experimental groups: (3) MPTP + Pgk1 (2 dpf): embryos at 2 dpf were injected with Pgk1 and treated with MPTP from 2 to 6 dpf; (4) MPTP + Pgk1 (4 dpf): embryos at 4 dpf were injected with Pgk1 and treated with MPTP from 2 to 6 dpf; and (5) MPTP + Pgk1 (2 + 4 dpf): embryos at 2 and 4 dpf were individually injected with Pgk1 and treated with MPTP from 2 to 6 dpf; and (6) MPTP + Pgk1-T378P (2 + 4 dpf): embryos at 2 and 4 dpf were individually injected with mutated Pgk1-T378P and treated with MPTP from 2 to 6 dpf. The swimming route of each zebrafish larva at 6 dpf was tracked using ImageJ software, and its swimming distance was calculated in cm. (A) The three times head touch-evoked swimming routes of a single larva in six groups of zebrafish larvae were recorded. (B) Statistical analysis of the total swimming distance (in cm) per larva in each group. The total distance of a single larva was the sum of swimming distance instigated by touches to the head and averaged from three trials. The total distance of each experiment was the average total distance obtained from 20 to 35 larvae, while that of each group was averaged from three independent experiments. Student’s t-test was used to determine significant differences between each group (***, p < 0.001).
|
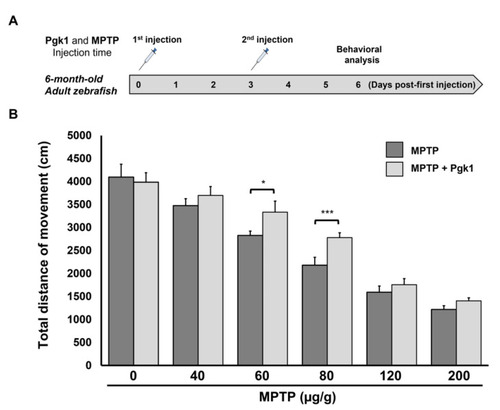
Figure 6. Direct injection of Pgk1 into the brain of adult zebrafish alleviates the impairment of swimming performance induced by MPTP. (A) Schematic diagram to illustrate the timetable of the six-month-old adult zebrafish being treated with intraperitoneal injections of MPTP, combined with a brain injection of Pgk1, followed by behavioral analysis. (B) Statistical analysis of total swimming distance (in cm) of adult fish treated with different concentrations of MPTP, as indicated, combined with, or without, a Pgk1 injection. The total swimming distance was averaged from three independent trials, and the distance of each trial was averaged from five adult fish, while the distance of a single fish sample was averaged from three touches. Student’s t-test was used to determine significant differences between each group (***, p < 0.001; *, p < 0.05).
|
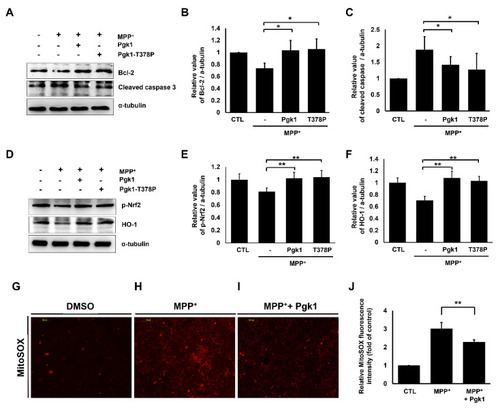
Extracellular addition of Pgk1 suppresses MPP+-induced apoptosis and mitochondrial ROS levels in SH-SY5Y cells. ( |