
FIGURE
Figure 3
- ID
- ZDB-FIG-220430-82
- Publication
- Lin et al., 2022 - Cerebroventricular Injection of Pgk1 Attenuates MPTP-Induced Neuronal Toxicity in Dopaminergic Cells in Zebrafish Brain in a Glycolysis-Independent Manner
- Other Figures
- All Figure Page
- Back to All Figure Page
Figure 3
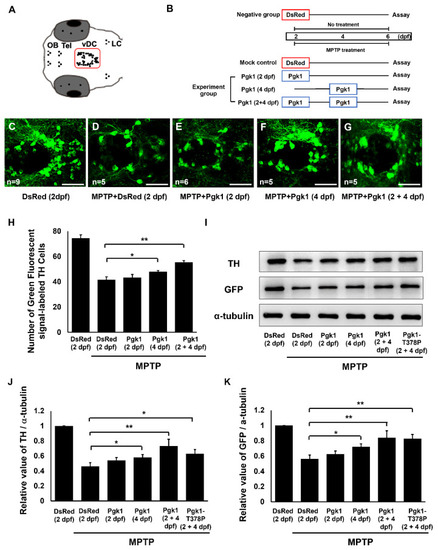
Figure 3. Direct injection of Pgk1 into the brain chamber prevents MPTP-induced dopaminergic cell death in the ventral diencephalon of zebrafish embryo at 6 dpf. (A) Schematic diagram depicts the distribution of dopaminergic neuronal cells in the brain of zebrafish embryo. The vDC region is marked with a square. (B) Schedule of MPTP treatment for embryos from 2 to 6 dpf. Negative control: embryos were injected with DsRed protein at 2 dpf without MPTP treatment. Mock control: embryos were injected with DsRed protein at 2 dpf and treated with 45 µM MPTP from 2 through 6 dpf. Experimental groups: Pgk1 was individually injected at 2, 4, and 2 plus 4 (2 + 4) dpf and then treated with MPTP from 2 to 6 dpf. Immunostaining assay was performed at 6 dpf. (C–G) Immunostaining of zebrafish embryos at 6 dpf. Using confocal microscopy, Tyrosine hydroxylase (TH)-specific antibody, labeled with a green fluorescence signal, could be observed in the vDC region of embryos with different treatments, as indicated. (H) Statistical analysis of the average number of the green fluorescent signal-labeled TH cells located in vDC. Number of examined embryos was indicated at the lower left corner of each panel. Projections of Z-stack images were generated with 2 µm. (I) Western blot analysis of the TH and GFP proteins expressed in the head of 10 larvae from transgenic line Tg(dat:EGFP) treated as indicated. The α-tubulin served as an internal control. The relative expression values of (J) TH and (K) GFP quantified from different groups after normalization of the expression level of α-tubulin. The level of each examined protein in the negative group set was expressed as 1. All data were averaged from three independent experiments and represented as mean ± S.D. Student’s t-test was used to determine significant differences between each group (**, p < 0.01; *, p < 0.05). OB: olfactory bulb; Tel: telencephalon; vDC: ventral diencephalon; LC: locus coeruleus. Scale bar, 50 μm.
|
Expression Data
Expression Detail
Antibody Labeling
Phenotype Data
Phenotype Detail
Acknowledgments
This image is the copyrighted work of the attributed author or publisher, and
ZFIN has permission only to display this image to its users.
Additional permissions should be obtained from the applicable author or publisher of the image.
Full text @ Int. J. Mol. Sci.