
- Title
-
Innervation modulates the functional connectivity between pancreatic endocrine cells
- Authors
- Yang, Y.H.C., Briant, L.J.B., Raab, C.A., Mullapudi, S.T., Maischein, H.M., Kawakami, K., Stainier, D.Y.R.
- Source
- Full text @ Elife
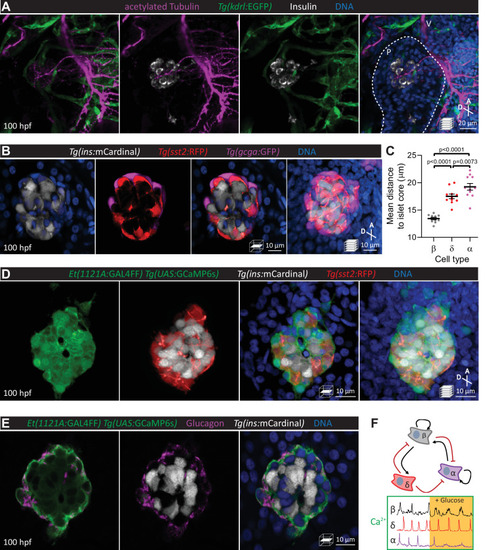
Pancreatic islet cell activity is visualized in vivo with preserved vascular and neural networks. (A) Wholemount immunostaining of wild-type zebrafish at 100 hours post fertilization (hpf) for acetylated Tubulin (nerves), Tg(kdrl:GFP) expression (vessels), and Insulin (beta cells), and counterstaining with DAPI (diamidino-2-phenylindole, DNA). (B) 100 hpf Tg(ins:mCardinal); Tg(sst2:RFP); Tg(gcga:GFP) zebrafish stained with DAPI (DNA). (C) Mean distance of pancreatic islet cells to islet core reveals a beta cell core and alpha cell mantle; mean ± SEM, n = 11 animals, p values from one-way analysis of variance (ANOVA) with Holm–Sidak’s multiple comparisons test; see Figure 1—source data 1. (D) 100 hpf Et(1121A:GAL4FF); Tg(UAS:GCaMP6s); Tg(ins:mCardinal); Tg(sst2:RFP) zebrafish stained with DAPI (DNA). (E) 100 hpf Et(1121A:GAL4FF); Tg(UAS:GCaMP6s); Tg(ins:mCardinal) zebrafish stained for Glucagon (alpha cells) and DNA. (F) Schematic of documented interactions between beta, delta, and alpha cells and of intracellular calcium recordings in each of these cell types. Maximum intensity projections or single planes are presented; A, anterior; D, dorsal; V, vagus nerve; P, pancreas. |
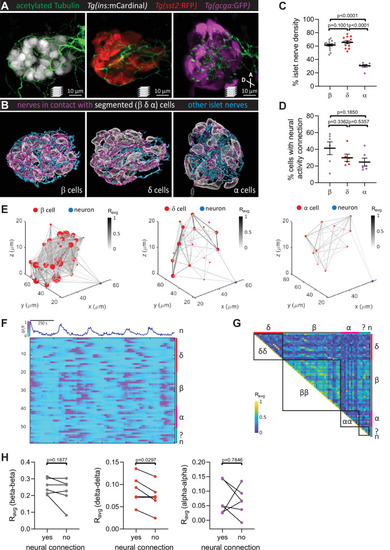
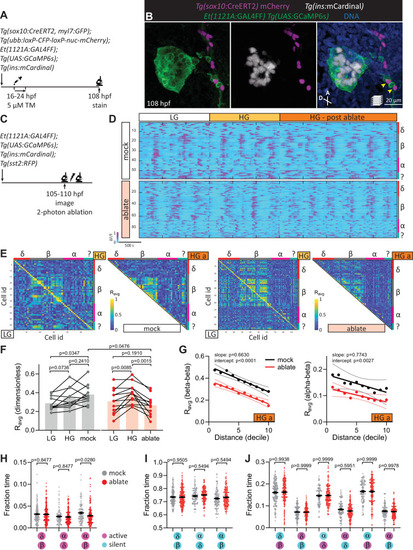
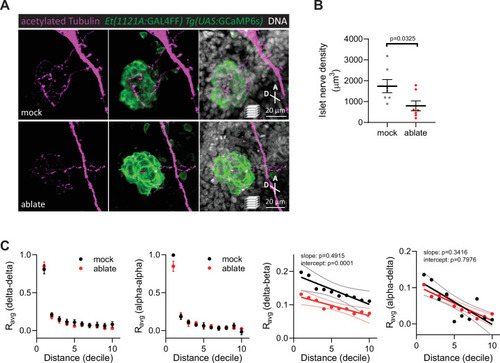
Pancreatic nerves display differential interactions with islet cell types. (A) 100 hpf Tg(ins:mCardinal), Tg(sst2:RFP), and Tg(gcga:GFP) zebrafish immuno-stained for acetylated Tubulin (nerves). (B) Segmentation and classification of islet nerves that are in contact with beta, delta, or alpha cell surfaces (magenta). All remaining islet nerves are colored in cyan. (C) Percentage of islet nerve density in contact with the specified pancreatic islet cell type; a majority of the nerves are in contact with beta and delta cells; mean ± standard error of the mean (SEM), n = 7–18 animals, p values from one-way analysis of variance (ANOVA) with Holm–Sidak’s multiple comparisons test; see Figure 2—source data 1. (D) Following exposure to elevated glucose and calcium imaging of pancreatic islet cells and peri-islet neurons at 105–110 hpf, correlation analysis was used to identify beta, delta, and alpha cells with neural activity connection. The percentage of cells of a given type with neural activity connection shows no significant difference between the different cell types; mean ± SEM, n = 6 animals, p values from one-way ANOVA with Holm–Sidak’s multiple comparisons test; see Figure 2—source data 2. (E) Correlation maps of a peri-islet neuron and beta, delta, and alpha cells. Individual cells are plotted with their coordinates. The strength of the correlation (Ravg) between cell pairs is drawn with a grayscale line and the number of connections for each cell is represented by the circle size. (F) Normalized calcium traces of pancreatic islet cells (including delta, beta, alpha, and unidentified cells) and a neuron (n). Individual islet cells were assigned to a cell type and given a cell id. (G) Correlation matrix of cell activity. Individual cells were assigned to a cell type (including delta, beta, alpha, and unidentified cells, and neurons) and average correlation coefficients for given cell pairs (matrix row-column intersects) were calculated. Areas displaying homotypic interactions are highlighted. (H) Average correlation coefficients from individual animals between homotypic cell pairs were divided into two groups (cells with or without neural connection); n = 6 animals, p values from paired t-tests. |
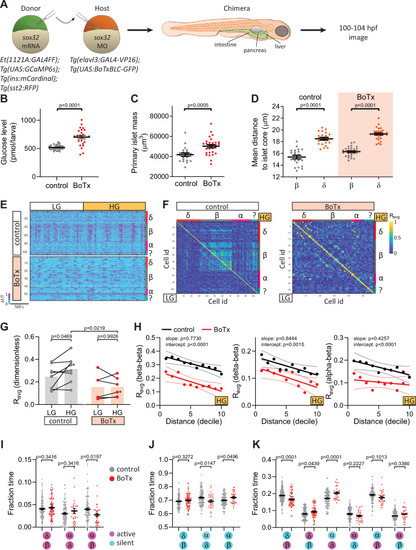
Chronic inhibition of synaptic transmission disrupts islet cell activity. (A) Schematic of transplants to generate chimeras with endodermal organs derived entirely from donor embryos. (B) Whole larva-free glucose-level measurements at 100 hpf; mean ± standard error of the mean (SEM), n = 24–32 batches of 5 larvae per replicate, p value from t-test; see Figure 3—source data. (C) Quantification of primary islet mass; n = 21–29, p value from t-test; see Figure 3—source data 2. (D) Mean distance of pancreatic islet cells to islet core; mean ± SEM, n = 21–29 animals, p values from paired t-tests; see Figure 3—source data 3. (E) Normalized calcium traces of pancreatic islet cells (including delta, beta, alpha, and unidentified cells). Individual islet cells were assigned to a cell type and given a cell id; LG, basal condition; HG, glucose treated condition. (F) Correlation matrices of islet cell activity. Individual islet cells were assigned to a cell type and given a cell id, and average correlation coefficients for given cell pairs (matrix row-column intersects) were calculated for LG (basal condition; bottom left triangle) and HG (glucose treated condition; top right triangle). (G) Average beta cell correlation coefficients in individual larvae; n = 5–8 animals, p values from two-way analysis of variance (ANOVA) with Holm–Sidak’s multiple comparisons test; *, corresponding calcium traces and correlation matrices shown in panels E and F. (H) Average homotypic (beta–beta) and heterotypic (delta–beta and alpha–beta) cell correlation coefficients with cell distance distribution from 1 (close) to 10 (far), mean and linear regression (solid lines) with 95% confidence intervals; n = 5–8 animals, p values of slope and intercept from simple linear regression. (I–K) Fraction time analysis of heterotypic delta–beta, alpha–delta, and alpha–beta cell pairs for times when both are active (I), both are silent (J), and one is active and one is silent (K); mean ± SEM, n = 32–160 cell pairs, p values from two-way ANOVA with Holm–Sidak’s multiple comparisons test; magenta circle, active state; cyan circle, silent state. |
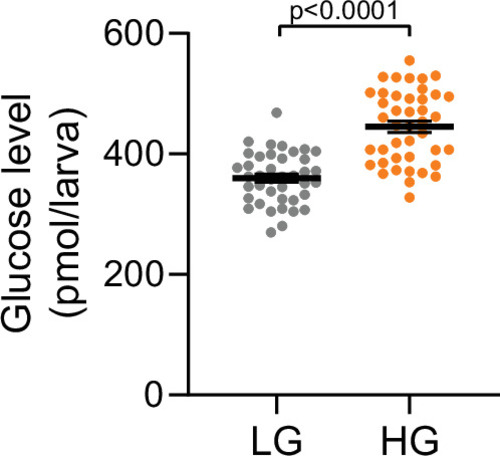
Zebrafish at 100 hpf were treated with 75 mM glucose in egg water for 1 hr. Whole larva-free glucose-level measurements at 101 hpf; mean ± standard error of the mean (SEM), |
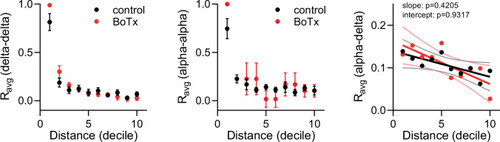
Average homotypic (delta–delta and alpha–alpha) and heterotypic (alpha–delta) cell correlation coefficients with cell distance distribution from 1 (close) to 10 (far), mean and linear regression (solid lines) with 95% confidence intervals; |
Calcium peak frequency, height, and duration (FWHM, full width half max) were analyzed for delta cells in individual animals; |
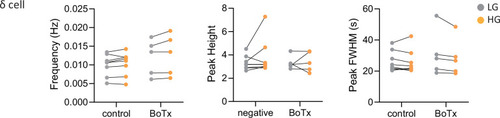
Targeted ablation studies reveal the crucial role of peri-islet neurons for islet cell activity.(A) Schematic of lineage tracing of neural crest cells in Tg(sox10:CreERT2, myl7:GFP); Tg(ubb:loxP-CFP-loxP-nuc-mCherry); Tg(ins:mCardinal); Et(1121A:GAL4FF); Tg(UAS:GCaMP6s) zebrafish following 5 µM tamoxifen (TM) treatment from 16 to 24 hpf and staining at 108 hpf. (B) Wholemount immunostaining at 108 hpf for mCherry expression (neural crest-derived cells) and counterstaining with DAPI (DNA). Yellow arrowheads point to neural crest-derived cells positive for GCaMP6s expression. (C) Schematic of two-photon ablation experiment. (D) Normalized calcium traces of pancreatic islet cells (including delta, beta, alpha, and unidentified cells). Individual islet cells were assigned to a cell type and given a cell id; LG, basal condition; HG, glucose treated condition; HG a, ablation or mock ablation condition. (E) Correlation matrices of islet cell activity; LG, basal condition; HG, glucose treated condition; HG a, ablation or mock ablation condition. (F) Average beta cell correlation coefficients in individual larvae; n = 11–12 animals, p values from two-way analysis of variance (ANOVA) with Holm–Sidak’s multiple comparisons test. (G) Average homotypic (beta–beta) and heterotypic (alpha–beta) cell correlation coefficients with cell distance distribution from 1 (close) to 10 (far), mean and linear regression (solid lines) with 95% confidence intervals; n = 11–12 animals, p values of slope and intercept from simple linear regression. Fraction time analysis of heterotypic delta–beta, alpha–delta, and alpha–beta cell pairs for times when both are active (H), both are silent (I), and one is active and one is silent (J); mean ± standard error of the mean (SEM), n = 178–215 cell pairs, p values from two-way ANOVA with Holm–Sidak’s multiple comparisons test; magenta circle, active state; cyan circle, silent state. |
( |
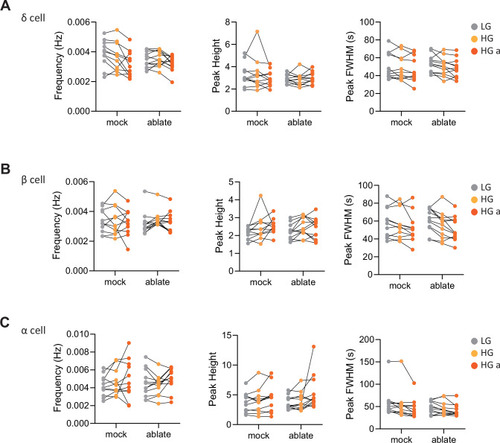
Calcium peak frequency, height, and duration (FWHM, full width half max) were analyzed for delta cells ( |
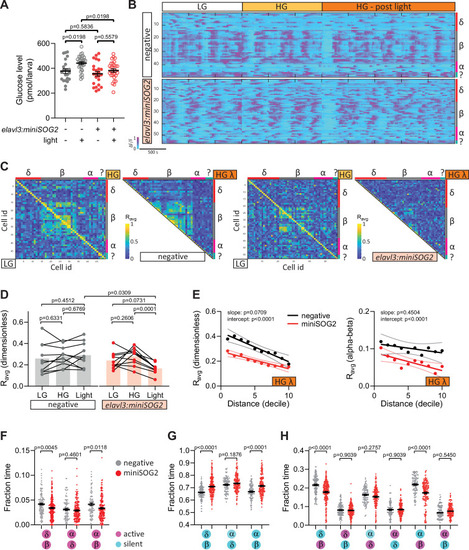
Acute optogenetic inhibition of neurotransmitter release disrupts islet cell activity.(A) Whole larva-free glucose-level measurements of Tg(elavl3:sypb-miniSOG2-P2A-mScarlet) zebrafish at 110 hpf; mean ± standard error of the mean (SEM), n = 22–31 batches of 5 larvae per replicate, p values from two-way analysis of variance (ANOVA) with Holm–Sidak’s multiple comparisons test; see Figure 5—source data 1. (B) Normalized calcium traces of pancreatic islet cells (including delta, beta, alpha, and unidentified cells). Individual islet cells were assigned to a cell type and given a cell id; LG, basal condition; HG, glucose treated condition. (C) Correlation matrices of islet cell activity; LG, basal condition; HG, glucose treated condition; HG λ, post-blue light treatment. (D) Average beta cell correlation coefficients in individual larvae; n = 10 animals, p values from two-way ANOVA with Holm–Sidak’s multiple comparisons test. (E) Average homotypic (beta–beta) and heterotypic (alpha–beta) cell correlation coefficients with cell distance distribution from 1 (close) to 10 (far), mean and linear regression (solid lines) with 95% confidence intervals; n = 10 animals, p values of slope and intercept from simple linear regression. Fraction time analysis of heterotypic delta–beta, alpha–delta, and alpha–beta cell pairs for times when both are active (F), both are silent (G), and one is active and one is silent (H); mean ± SEM, n = 141–220 cell pairs, p values from two-way ANOVA with Holm–Sidak’s multiple comparisons test; magenta circle, active state; cyan circle, silent state. |
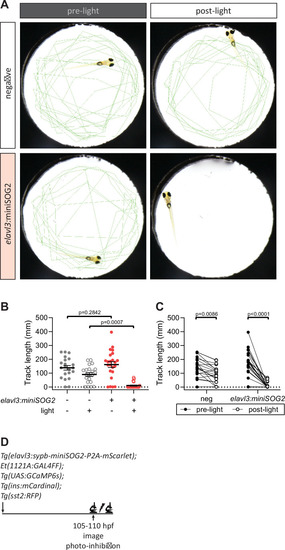
(A) Swimming activity of Tg(elavl3:sypb-miniSOG2-P2A-mScarlet) zebrafish at 110 hpf was tracked pre- and post-blue light exposure for 5 min. Green lines show tracks at the end of the time-lapse. (B, C) Quantification of swimming activity of Tg(elavl3:sypb-miniSOG2-P2A-mScarlet) zebrafish at 110 hpf; mean ± standard error of the mean (SEM), n = 21–23 animals, p values from two-way analysis of variance (ANOVA) with Holm–Sidak’s multiple comparisons test. (D) Schematic of optogenetic neural inhibition experiment. |
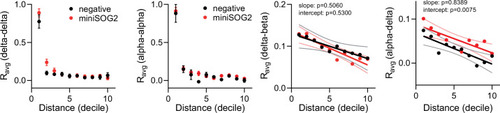
Average homotypic (delta–delta and alpha–alpha) and heterotypic (delta–beta and alpha–delta) cell correlation coefficients with cell distance distribution from 1 (close) to 10 (far), mean ± standard error of the mean (SEM) and linear regression (solid lines) with 95% confidence intervals; |
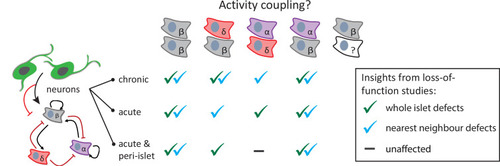
Graphical abstract summarizing the research findings. Neuromodulation, with varying temporal and spatial specificity, provides useful insights into the role of neurons in regulating homotypic and heterotypic activity coupling between pancreatic islet cells. Green check marks indicate when significant defects were observed in correlation-based analysis across the whole islet. Blue check marks indicate when significant defects were observed in fraction time analysis between nearest neighbors. |