
|
Figure 5
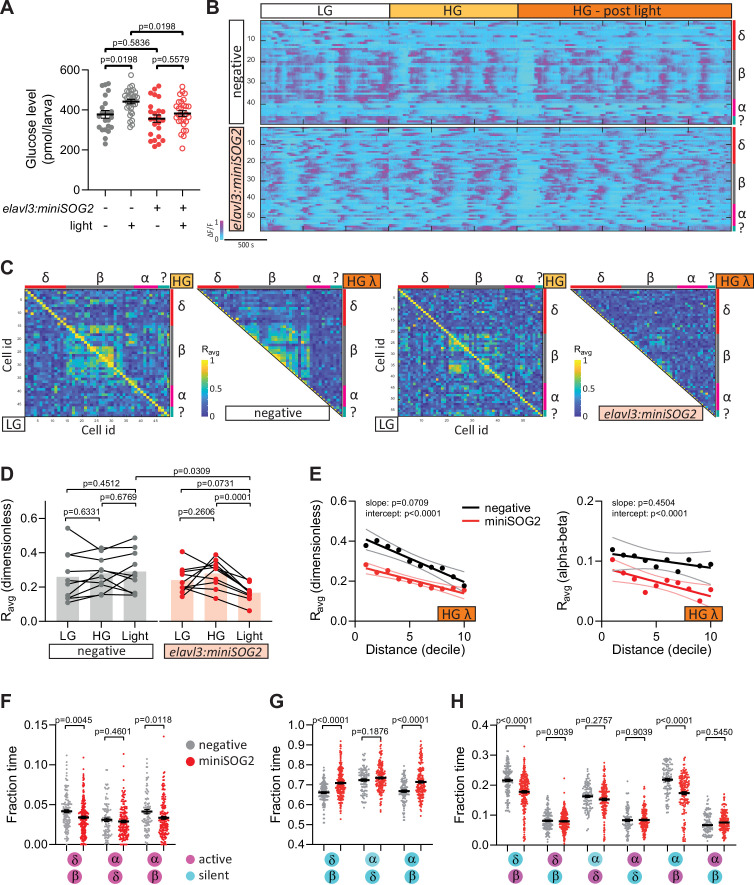
Acute optogenetic inhibition of neurotransmitter release disrupts islet cell activity.
(A) Whole larva-free glucose-level measurements of Tg(elavl3:sypb-miniSOG2-P2A-mScarlet) zebrafish at 110 hpf; mean ± standard error of the mean (SEM), n = 22–31 batches of 5 larvae per replicate, p values from two-way analysis of variance (ANOVA) with Holm–Sidak’s multiple comparisons test; see Figure 5—source data 1. (B) Normalized calcium traces of pancreatic islet cells (including delta, beta, alpha, and unidentified cells). Individual islet cells were assigned to a cell type and given a cell id; LG, basal condition; HG, glucose treated condition. (C) Correlation matrices of islet cell activity; LG, basal condition; HG, glucose treated condition; HG λ, post-blue light treatment. (D) Average beta cell correlation coefficients in individual larvae; n = 10 animals, p values from two-way ANOVA with Holm–Sidak’s multiple comparisons test. (E) Average homotypic (beta–beta) and heterotypic (alpha–beta) cell correlation coefficients with cell distance distribution from 1 (close) to 10 (far), mean and linear regression (solid lines) with 95% confidence intervals; n = 10 animals, p values of slope and intercept from simple linear regression. Fraction time analysis of heterotypic delta–beta, alpha–delta, and alpha–beta cell pairs for times when both are active (F), both are silent (G), and one is active and one is silent (H); mean ± SEM, n = 141–220 cell pairs, p values from two-way ANOVA with Holm–Sidak’s multiple comparisons test; magenta circle, active state; cyan circle, silent state.