
|
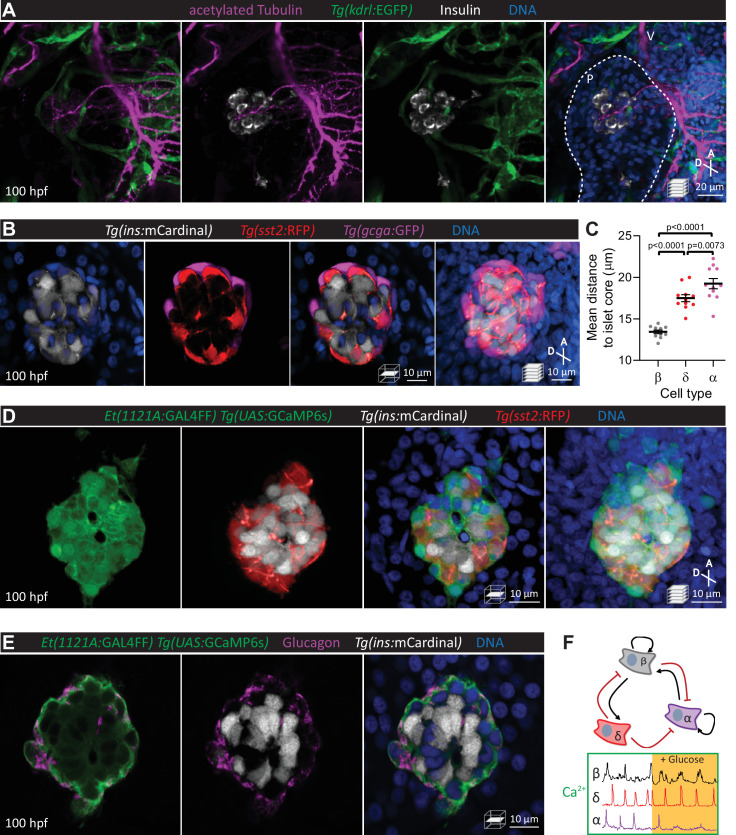
Figure 1 Pancreatic islet cell activity is visualized in vivo with preserved vascular and neural networks.
(A) Wholemount immunostaining of wild-type zebrafish at 100 hours post fertilization (hpf) for acetylated Tubulin (nerves), Tg(kdrl:GFP) expression (vessels), and Insulin (beta cells), and counterstaining with DAPI (diamidino-2-phenylindole, DNA). (B) 100 hpf Tg(ins:mCardinal); Tg(sst2:RFP); Tg(gcga:GFP) zebrafish stained with DAPI (DNA). (C) Mean distance of pancreatic islet cells to islet core reveals a beta cell core and alpha cell mantle; mean ± SEM, n = 11 animals, p values from one-way analysis of variance (ANOVA) with Holm–Sidak’s multiple comparisons test; see Figure 1—source data 1. (D) 100 hpf Et(1121A:GAL4FF); Tg(UAS:GCaMP6s); Tg(ins:mCardinal); Tg(sst2:RFP) zebrafish stained with DAPI (DNA). (E) 100 hpf Et(1121A:GAL4FF); Tg(UAS:GCaMP6s); Tg(ins:mCardinal) zebrafish stained for Glucagon (alpha cells) and DNA. (F) Schematic of documented interactions between beta, delta, and alpha cells and of intracellular calcium recordings in each of these cell types. Maximum intensity projections or single planes are presented; A, anterior; D, dorsal; V, vagus nerve; P, pancreas.