
Image
|
Figure Caption
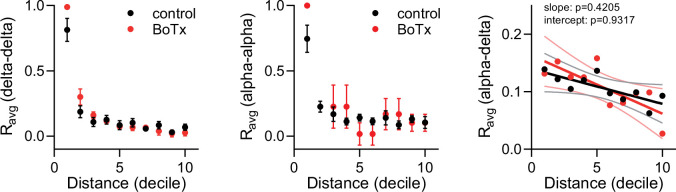
Figure 3—figure supplement 2.
Average homotypic (delta–delta and alpha–alpha) and heterotypic (alpha–delta) cell correlation coefficients with cell distance distribution from 1 (close) to 10 (far), mean and linear regression (solid lines) with 95% confidence intervals;
Acknowledgments
This image is the copyrighted work of the attributed author or publisher, and
ZFIN has permission only to display this image to its users.
Additional permissions should be obtained from the applicable author or publisher of the image.
Full text @ Elife