
|
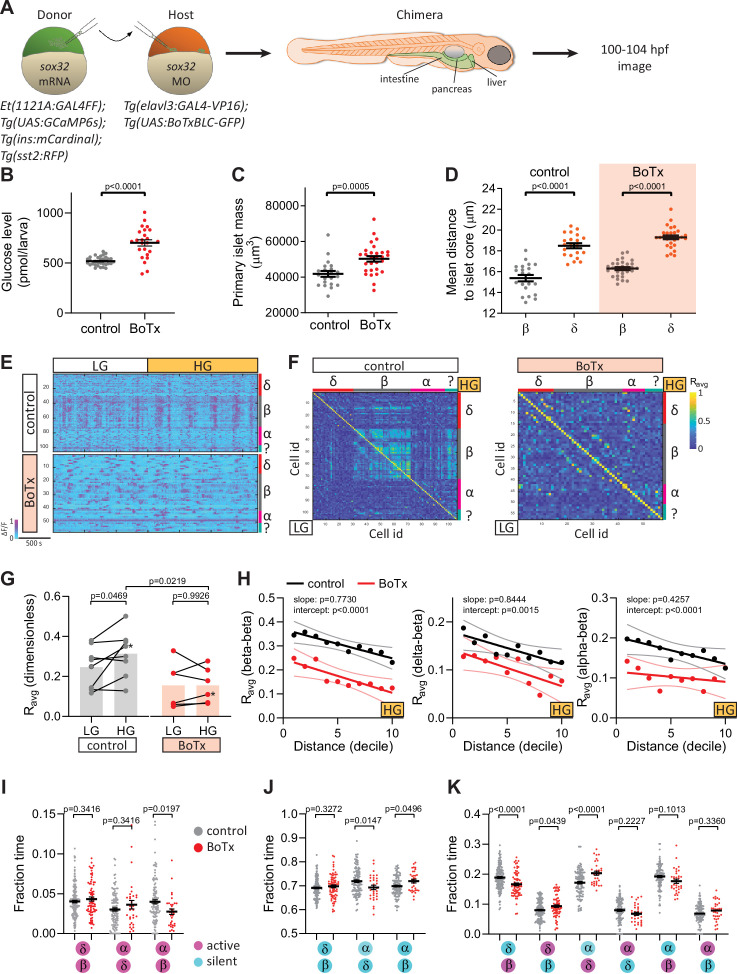
Figure 3 Chronic inhibition of synaptic transmission disrupts islet cell activity.
(A) Schematic of transplants to generate chimeras with endodermal organs derived entirely from donor embryos. (B) Whole larva-free glucose-level measurements at 100 hpf; mean ± standard error of the mean (SEM), n = 24–32 batches of 5 larvae per replicate, p value from t-test; see Figure 3—source data. (C) Quantification of primary islet mass; n = 21–29, p value from t-test; see Figure 3—source data 2. (D) Mean distance of pancreatic islet cells to islet core; mean ± SEM, n = 21–29 animals, p values from paired t-tests; see Figure 3—source data 3. (E) Normalized calcium traces of pancreatic islet cells (including delta, beta, alpha, and unidentified cells). Individual islet cells were assigned to a cell type and given a cell id; LG, basal condition; HG, glucose treated condition. (F) Correlation matrices of islet cell activity. Individual islet cells were assigned to a cell type and given a cell id, and average correlation coefficients for given cell pairs (matrix row-column intersects) were calculated for LG (basal condition; bottom left triangle) and HG (glucose treated condition; top right triangle). (G) Average beta cell correlation coefficients in individual larvae; n = 5–8 animals, p values from two-way analysis of variance (ANOVA) with Holm–Sidak’s multiple comparisons test; *, corresponding calcium traces and correlation matrices shown in panels E and F. (H) Average homotypic (beta–beta) and heterotypic (delta–beta and alpha–beta) cell correlation coefficients with cell distance distribution from 1 (close) to 10 (far), mean and linear regression (solid lines) with 95% confidence intervals; n = 5–8 animals, p values of slope and intercept from simple linear regression. (I–K) Fraction time analysis of heterotypic delta–beta, alpha–delta, and alpha–beta cell pairs for times when both are active (I), both are silent (J), and one is active and one is silent (K); mean ± SEM, n = 32–160 cell pairs, p values from two-way ANOVA with Holm–Sidak’s multiple comparisons test; magenta circle, active state; cyan circle, silent state.