
- Title
-
The alx3 gene shapes the zebrafish neurocranium by regulating frontonasal neural crest cell differentiation timing
- Authors
- Mitchell, J.M., Sucharov, J., Pulvino, A.T., Brooks, E.P., Gillen, A.E., Nichols, J.T.
- Source
- Full text @ Development
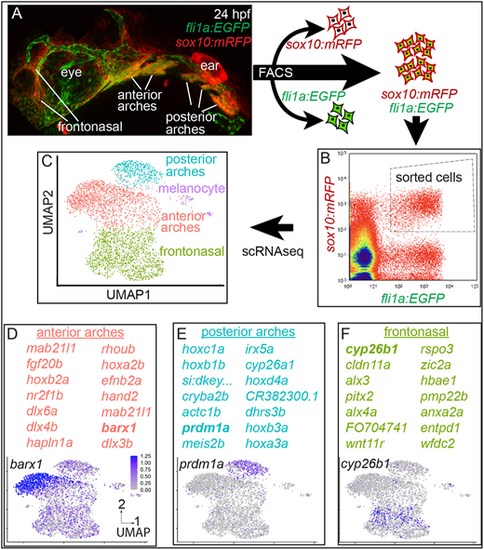
(A) Post-migratory NCCs are double transgenic (fli1a:EGFP;sox10:mRFP) and reside in the frontonasal region and in the anterior and posterior pharyngeal arches. Double transgenic animals were dissociated into single-cell suspension. (B) Scatter plot from FACS. Dashed box indicates double-positive cells sorted for single-cell transcriptomics. (C) scRNA-seq clusters double-transgenic NCCs into four distinct populations. (D-F) Genes enriched in each cluster indicate population identity. Example plots for the genes shown in bold are displayed. All individual feature plots have the same scale indicated in D. EXPRESSION / LABELING:
|

(A) Individual UMAP feature plots for the Alx transcription factor-encoding genes. alx1, alx3, alx4a and alx4b are enriched in the frontonasal NCC population relative to other populations. All individual feature plots have the same scale. (B) Violin plots illustrate relative Alx gene expression in the anterior arches (aa), frontonasal region (fn), posterior arches (pa) and melanocyte population (m). (C-E) In situ hybridization reveals where the alx3-expressing frontonasal population resides in intact embryos: alx3 is strongly expressed in NCCs residing between the eye and the nasal placode (np) (C), alx3-expressing cells are found medial to the nasal placodes (D) and alx3 is expressed in cells ventral to the nasal placodes (E). Scale bars: 50 µm. EXPRESSION / LABELING:
|
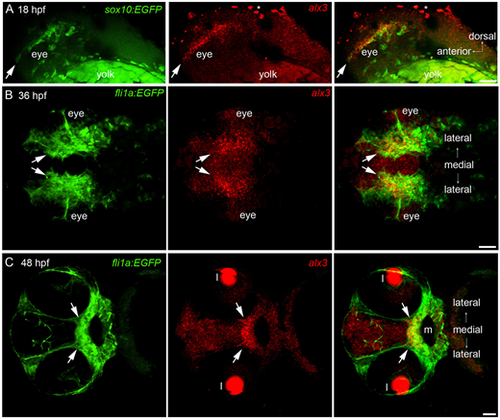
(A) In situ hybridization revealing alx3 expression in an anterior stream of migrating NCCs (arrows), which is also labeled with sox10:GFP. Lateral view. (B) Arrows indicate an anterior subset of post-migratory NCCs ventral and medial to the eye that express alx3 and fli1a:GFP. Ventral view. (C) Arrows indicate alx3 expression in post-migratory NCCs on the roof of the mouth (m). Cells in this region are differentiating into ethmoid plate chondrocytes at this stage. Ventral view. All post-migratory NCCs, their derivatives, and the developing vasculature express fli1a:GFP. Lens (l) and yolk granules (asterisks) autofluorescence are indicated. Scale bars: 50 µm. EXPRESSION / LABELING:
|
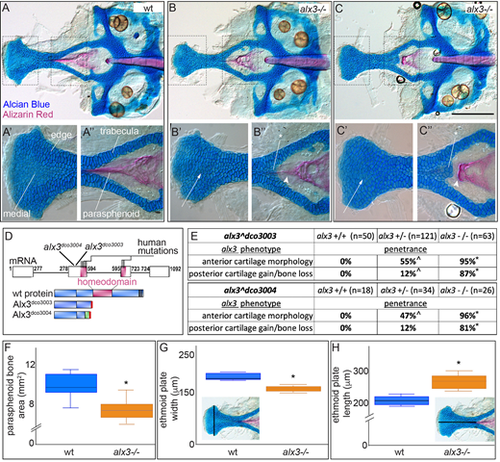
(A-A″) Dissected wild-type (wt) zebrafish neurocranium. The boxed regions are shown at higher magnification in A′,A″, with edge and medial cells indicated. The trabeculae are thin and the parasphenoid bone stains strongly. (B-B″) In some alx3 homozygous mutants, ethmoid plate cells near the midline stain darker with Alcian Blue (arrows) than medial cells in the wild type, and ectopic chondrocytes (asterisk) appear where the trabeculae meet along with reduced and misshaped parasphenoid bone (arrowhead). (C-C″) In more severe alx3 homozygous mutants, ethmoid plate cells near the midline have considerably stronger Alcian Blue staining (arrows) compared with medial cells in the wild type. Ectopic chondrocytes (asterisk) develop along with a blunted parasphenoid bone (arrowhead). (D) Consensus alx3 exon diagram with human and zebrafish mutant alleles indicated. Schematics below illustrate the predicted wild-type and mutant proteins. Red indicates a premature termination codon and green missense amino acids. (E) Anterior and posterior phenotype penetrance is significantly different in both heterozygotes and homozygous mutants compared with wild types (*P<0.0001; ^P<0.01; Fishers exact test). Neurocranium defect penetrance is similar between the two mutant alleles. (F) Parasphenoid bone area is significantly reduced in alx3 mutants. (G) Width of the ethmoid plate is significantly decreased in alx3 mutants. (H) Length of the ethmoid plate is significantly increased in alx3 mutants. Examples of how measurements were taken are inlaid in G and H. For box plots, boxes represent the interquartile range, whiskers are the data range and the lines are the medians. *P<0.0005 (unpaired t-test, n=18). In all images, anterior is to the left. Scale bar: 100 µm. PHENOTYPE:
|

(A) Still frames from time-lapse recordings of craniofacial progenitors. At 24 hpf, NCCs that are lateral (l), medial (m) and ventral (v) to the nasal placode (np) express alx3 (see Fig. 2C-E). Arrows indicate that postmigratory NCCs are present in both wild types (wt) and mutants. At 36 hpf, NCCs ventral and medial (vm) to the eye express alx3 (see Fig. 3B). Arrows illustrate that these cells are present in both wild types and alx3 mutants. All images are frontal view. (B) Semi-automated quantification of cell movement reveals no significant differences (unpaired t-test) between wild types and mutants. We tracked multiple cell movement parameters from 728 wild-type and 886 alx3 mutant cells from six embryos of each genotype. For box plots, boxes represent the interquartile range, whiskers are the data range, the lines are the medians and x represents the mean. Scale bar: 60 µm. |
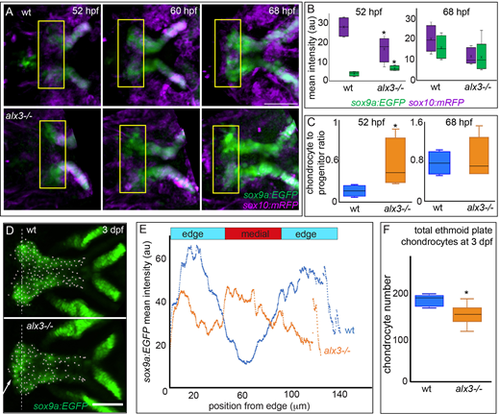
(A) Still frames from time-lapse recordings of chondrocyte differentiation in the ethmoid plate. Fluorescence associated with progenitor cells (sox10:mRFP) and chondrocytes (sox9a:EGFP) was quantified within the yellow boxed regions at the anterior end of the ethmoid plate. (B) During early chondrocyte differentiation, the signal associated with progenitors is significantly decreased whereas the signal associated with differentiated chondrocytes is significantly increased in alx3 mutants compared with wild types (*P<0.05; unpaired t-test, n=8). By 68 hpf the signal associated with both progenitors and chondrocytes are no longer significantly different between wild types and mutants. Time-lapse recordings from eight individuals with each genotype were quantified. (C) The data in B were used to calculate the ratio of differentiated chondrocytes to progenitor cells. At 52 hpf, this ratio is significantly higher in alx3 mutants compared with wild types; by 68 hpf the ratio is indistinguishable between mutants and wild types (*P<0.05; unpaired t-test, n=8). (D) sox9a:EGFP marks ethmoid plate chondrocytes. Arrow indicates increased chondrocytes near the midline in alx3 mutants compared with wild types. Dashed line indicates the vector used for the quantification in E, and dots are the automated calling of individual chondrocytes quantified in F. (E) Nine animals from each genotype were imaged as in D and the mean fluorescence along a vector was calculated and plotted versus the widest mediolateral distance across the anterior end of the ethmoid plate. Medial sox9a:EGFP fluorescence is significantly higher in alx3 mutants compared with wild types (Kruskal–Wallis). The total distance across the ethmoid plate was divided into thirds to determine the edge and medial regions of this skeletal element. (F) The total number of ethmoid plate chondrocytes was determined from the images used in E. There are significantly fewer chondrocytes in mutants (*P<0.005; unpaired t-test). For box plots, boxes represent the interquartile range, whiskers are the data range, the lines are the medians and x represents the mean. Scale bars: 50 µm. |
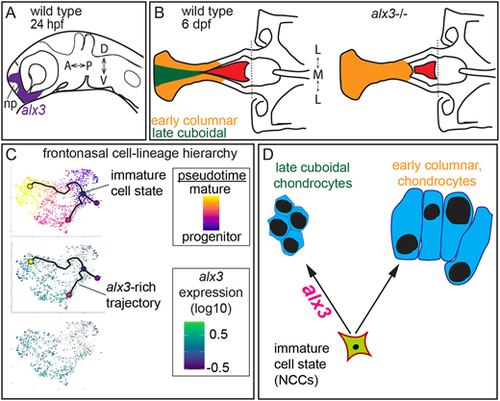
(A) Diagram of zebrafish alx3 expression in post-migratory frontonasal NCCs surrounding the nasal placode (np) at 24 hpf. (B) Schematic summarizing the neurocranium skeletal phenotypes found in alx3 mutants. In wild types, the anterior ethmoid plate comprises two populations of chondrocytes and the sword-shaped parasphenoid bone extends to an anterior point. In alx3 mutants, the ethmoid plate chondrocyte morphology and differentiation timing are more homogeneous and the parasphenoid bone is anteriorly truncated. (C) Lineage trajectory analyses predict a sequence of cellular states in frontonasal NCCs. The immature, early cells pass through three alternative trajectories towards mature, late cell states. alx3 expression is strongly enriched along one trajectory. (D) alx3 function is required in post-migratory frontonasal NCCs for distinct skeletal cell populations in the zebrafish neurocranium. A, anterior; D, dorsal; L, lateral; M, medial; P, posterior; V, ventral. |