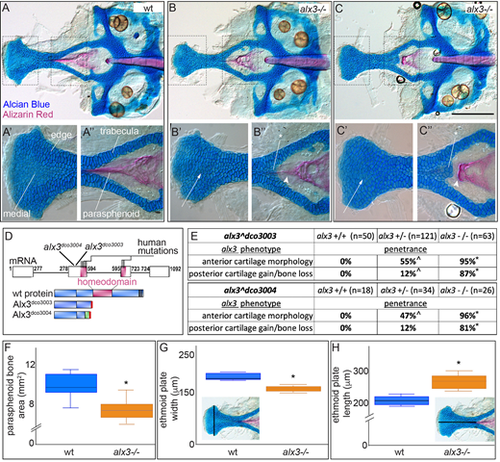
(A-A″) Dissected wild-type (wt) zebrafish neurocranium. The boxed regions are shown at higher magnification in A′,A″, with edge and medial cells indicated. The trabeculae are thin and the parasphenoid bone stains strongly. (B-B″) In some alx3 homozygous mutants, ethmoid plate cells near the midline stain darker with Alcian Blue (arrows) than medial cells in the wild type, and ectopic chondrocytes (asterisk) appear where the trabeculae meet along with reduced and misshaped parasphenoid bone (arrowhead). (C-C″) In more severe alx3 homozygous mutants, ethmoid plate cells near the midline have considerably stronger Alcian Blue staining (arrows) compared with medial cells in the wild type. Ectopic chondrocytes (asterisk) develop along with a blunted parasphenoid bone (arrowhead). (D) Consensus alx3 exon diagram with human and zebrafish mutant alleles indicated. Schematics below illustrate the predicted wild-type and mutant proteins. Red indicates a premature termination codon and green missense amino acids. (E) Anterior and posterior phenotype penetrance is significantly different in both heterozygotes and homozygous mutants compared with wild types (*P<0.0001; ^P<0.01; Fishers exact test). Neurocranium defect penetrance is similar between the two mutant alleles. (F) Parasphenoid bone area is significantly reduced in alx3 mutants. (G) Width of the ethmoid plate is significantly decreased in alx3 mutants. (H) Length of the ethmoid plate is significantly increased in alx3 mutants. Examples of how measurements were taken are inlaid in G and H. For box plots, boxes represent the interquartile range, whiskers are the data range and the lines are the medians. *P<0.0005 (unpaired t-test, n=18). In all images, anterior is to the left. Scale bar: 100 µm.
|
