
- Title
-
Feedback Control of the Gpr161-Gαs-PKA axis contributes to basal Hedgehog repression in zebrafish
- Authors
- Tschaikner, P., Regele, D., Röck, R., Salvenmoser, W., Meyer, D., Bouvier, M., Geley, S., Stefan, E., Aanstad, P.
- Source
- Full text @ Development
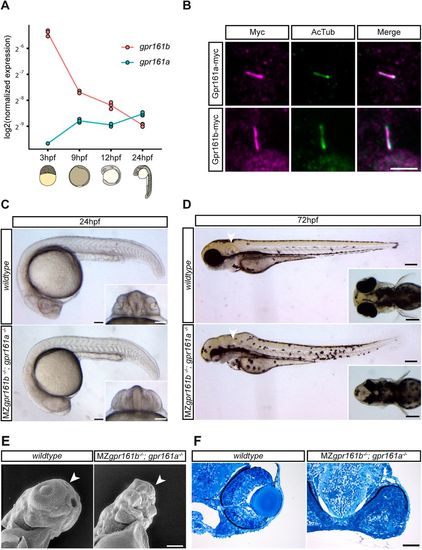
Gpr161 is an evolutionarily conserved ciliary GPCR that is essential during embryonic development. (A) gpr161a and gpr161b transcript levels at different stages of development analysed in whole-embryo lysates in triplicate using RT-qPCR. (B) Wild-type embryos were injected with gpr161a-myc or gpr161b-myc mRNA at the one-cell stage and fixed at 9 hpf before immunostaining for acetylated tubulin (AcTub; purple), a marker for the ciliary axoneme, and Myc (green). Scale bar: 5 µm. (C) Lateral views of wild-type and MZgpr161b−/−; gpr161a−/− embryos at 24 hpf. Insets show ventral views of the developing eyes; arrowheads indicate the otic vesicle. Scale bars: 100 µm. (D) Wild-type and MZgpr161b−/−; gpr161a−/− embryos at 72 hpf. Arrowheads indicate otic vesicle. Scale bars: 200 µm. Insets show a dorsal view of the head. (E) Ventrolateral views of the craniofacial region of wild-type and MZgpr161b−/−; gpr161a−/− embryos at 72 hpf taken by scanning electron microscopy; arrowheads indicate the olfactory pit. Scale bar: 100 µm. (F) Transverse semi-thin sections of the eye in wild-type and MZgpr161b−/−; gpr161a−/− embryos fixed at 72 hpf (Richardson staining). Scale bar: 50 µm. PHENOTYPE:
|
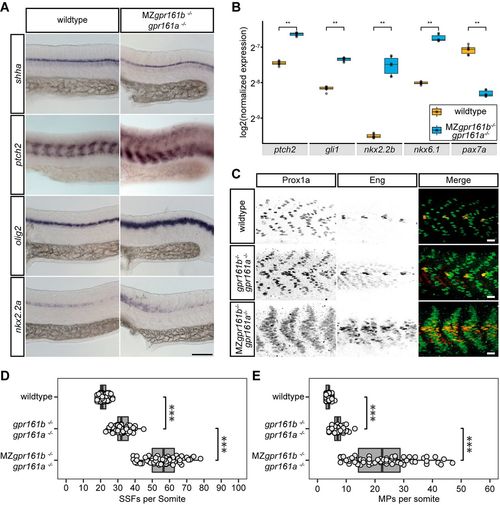
Hh signalling activity is increased in gpr161 mutants. (A) RNA in situ hybridisation of shha, ptch2, olig2 and nkx2.2a transcripts in wild-type and MZgpr161b−/−; gpr161a−/− embryos fixed at 24 hpf (lateral view). Scale bar: 100 µm. (B) Transcript levels of ptch2, gli1, nkx2.2b, nkx6.1 and pax7a in wild-type and MZgpr161b−/−; gpr161a−/− embryos at 24 hpf determined by RT-qPCR (n=3; **P<0.01, Kruskal–Wallis rank sum test, Dunn's post-hoc test for multiple comparisons). (C) Immunostaining of Prox1 and Eng proteins in 24 hpf zebrafish embryos reveals the number of MPs (Prox1a/Eng double positive) as well as SFFs (Prox1 positive) in wild-type, gpr161b−/−; gpr161a−/− and MZgpr161b−/−; gpr161−/− embryos fixed at 24 hpf. Scale bars: 20 µm. (D,E) Number of (D) SSFs and (E) MPs per somite in wild-type (n=93 somites in 22 embryos), gpr161b−/−; gpr161a−/− (n=60 somites in 20 embryos) and MZgpr161b−/−; gpr161a−/− (n=66 somites in 22 embryos) embryos fixed at 24 hpf. ***P<0.001 (one-way ANOVA, Tukey's post-hoc test for pairwise comparisons). Box plots show median values (centre lines) and the interquartile ranges (boxes); whiskers extend to the highest and lowest values within 1.5×IQR (inter-quartile range). |
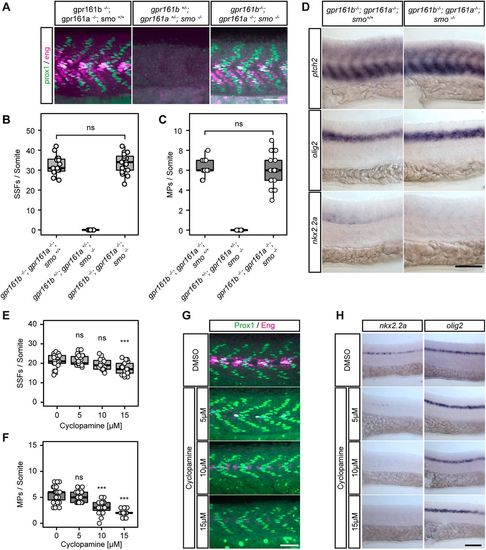
Constitutive activation of low- and medium- but not high-level Hh targets in gpr161 mutants. (A) Prox1 (green)/Eng (purple) immunostaining of mutant embryos at 24 hpf. Scale bar: 50 µm. (B,C) Quantification of SSFs and MPs from experiments presented in A (gpr161b−/−; gpr161a−/−; smo+/+ and gpr161b+/−; gpr161a+/−; smo−/−: n=15 somites in five embryos; gpr161b−/−; gpr161a−/−; smo−/−: n=21 somites in seven embryos; all others: n=27 somites in nine embryos; ns, not significant; one-way ANOVA, Tukey's post-hoc test for pairwise comparisons). (D) RNA in situ hybridisation of ptch2, olig2 and nkx2.2a transcripts in gpr161b−/−; gpr161a−/−; smo+/+ and gpr161b−/−; gpr161a−/−; smo−/−embryos fixed at 24 hpf (lateral view). Scale bar: 100 µm. (E,F) Quantification of SSFs and MPs in wild-type embryos at 24 hpf after treatment with 0-15 µM cyclopamine (DMSO and 5 µM cyclopamine: n=27 somites in nine embryos; 10 µM cyclopamine: n=15 somites in five embryos; 15 mM cyclopamine: n=21 somites in seven embryos; ***P<0.001; ns, not significant; one-way ANOVA, Tukey's post-hoc test for pairwise comparisons). (G) Representative Prox1 (green)/Eng (purple) immunostaining of wild-type embryos at 24 hpf after treatment with 0-15 µM cyclopamine. Scale bar: 50 µm. (H) RNA in situ hybridisation of nkx2.2a and olig2 transcripts in wild-type embryos at 24 hpf after treatment with 0-15 µM cyclopamine (lateral view). Scale bar: 100 µm. (A,C,G) The high levels of Eng (purple) staining in the gpr161 double mutants (A) and DMSO-treated gpr161 mutants (G) are due to Hh-dependent Eng-positive, Prox1-negative medial fast fibres, which are not included in the quantification (C). Box plots show median values (centre lines) and the interquartile ranges (boxes); whiskers extend to the highest and lowest values within 1.5×IQR (inter-quartile range). |
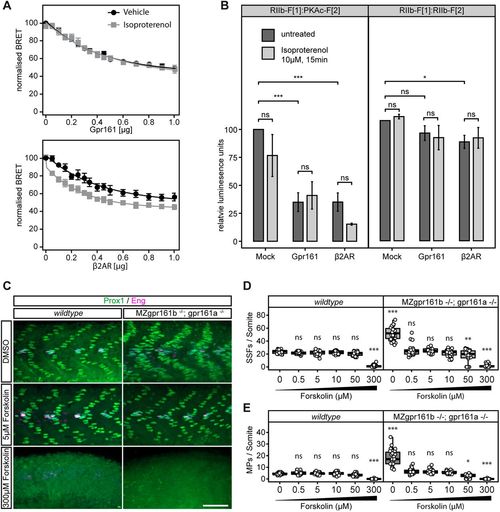
cAMP elevation rescues the gpr161 phenotype. (A) The reporter constructs, together with increasing concentrations of β2AR (positive control) and Gpr161 receptor constructs, were transiently expressed in HEK293 cells followed by treatment with the β2AR-specific agonist isoproterenol (10 µM, 15 min). BRET readout was measured using the Mithras LB 940 plate reader (±s.d. of n=4 independent experiments), and normalised to the 0 µg receptor transfection experiments. (B) IMCD3 cells were transiently transfected with the constructs for the PKAc:RIIb RLuc PCA combination to assess PKA activation in response to Gpr161 and β2AR expression, and stimulation by isoproterenol (10 µM for 15 min). RIIb-F1/RIIb-F2 RLuc PCA constructs were used as a negative control. The readouts were normalised to untreated 0 µg receptor transfection experiments (±s.d. of n=3 independent experiments; ***P<0.001, *P<0.05; ns, not significant; two-way ANOVA, Tukey's post-hoc test for pairwise comparisons). (C) Prox1 (green)/Eng (purple) immunostaining of wild-type and MZgpr161b−/−; gpr161a−/− embryos treated with increasing concentrations of forskolin. Scale bar: 50 µm. (D,E) Quantification of SSFs and MPs in wild-type and MZgpr161b−/−; gpr161a−/− embryos treated with increasing concentrations of forskolin (for each experiment, n=27 somites in nine embryos; ***P<0.001, **P<0.01, *P<0.05; ns, not significant; two-way ANOVA, Tukey's post-hoc test for pairwise comparisons). Box plots show median values (centre lines) and the interquartile ranges (boxes); whiskers extend to the highest and lowest values within 1.5×IQR (inter-quartile range). |
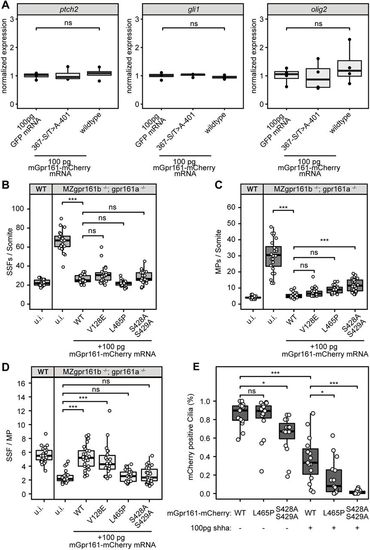
Overexpression of mGpr161-mCherry in wild-type and MZgpr161b−/−; gpr161a−/− embryos. (A) Injections of 100 pg mGpr161376-S/T>A-401-mCherry or wild-type mGpr161-mCherry mRNA do not lead to an upregulation of the Hh-targets ptch2, gli1 or olig2 compared with control injections with 100 pg GFP mRNA (n=4; ns not significant, Kruskal–Wallis rank sum test). (B,C) Quantification of SSFs and MPs upon injection of different mGpr161 mRNAs into gpr161 mutants (n=22-27 somites in seven to nine embryos; ***P<0.001, *P<0.05; ns, not significant; one-way ANOVA, Tukey's post-hoc test for pairwise comparisons). Wild-type uninjected values are shown for comparison. (D) SSF/MP ratios within the somites quantified in B,C. (E) Quantification of mCherry-positive cilia at 9 hpf after injection of 100 pg mRNA of mGpr161-mCherry transcripts in response to co-injection of 100 pg shha mRNA (n=15 embryos from three experiments; ***P<0.001, *P<0.05; ns, not significant, two-way ANOVA, Tukey's post-hoc test for pairwise comparisons). Box plots show median values (centre lines) and the interquartile ranges (boxes); whiskers extend to the highest and lowest values within 1.5×IQR (inter-quartile range). |