
|
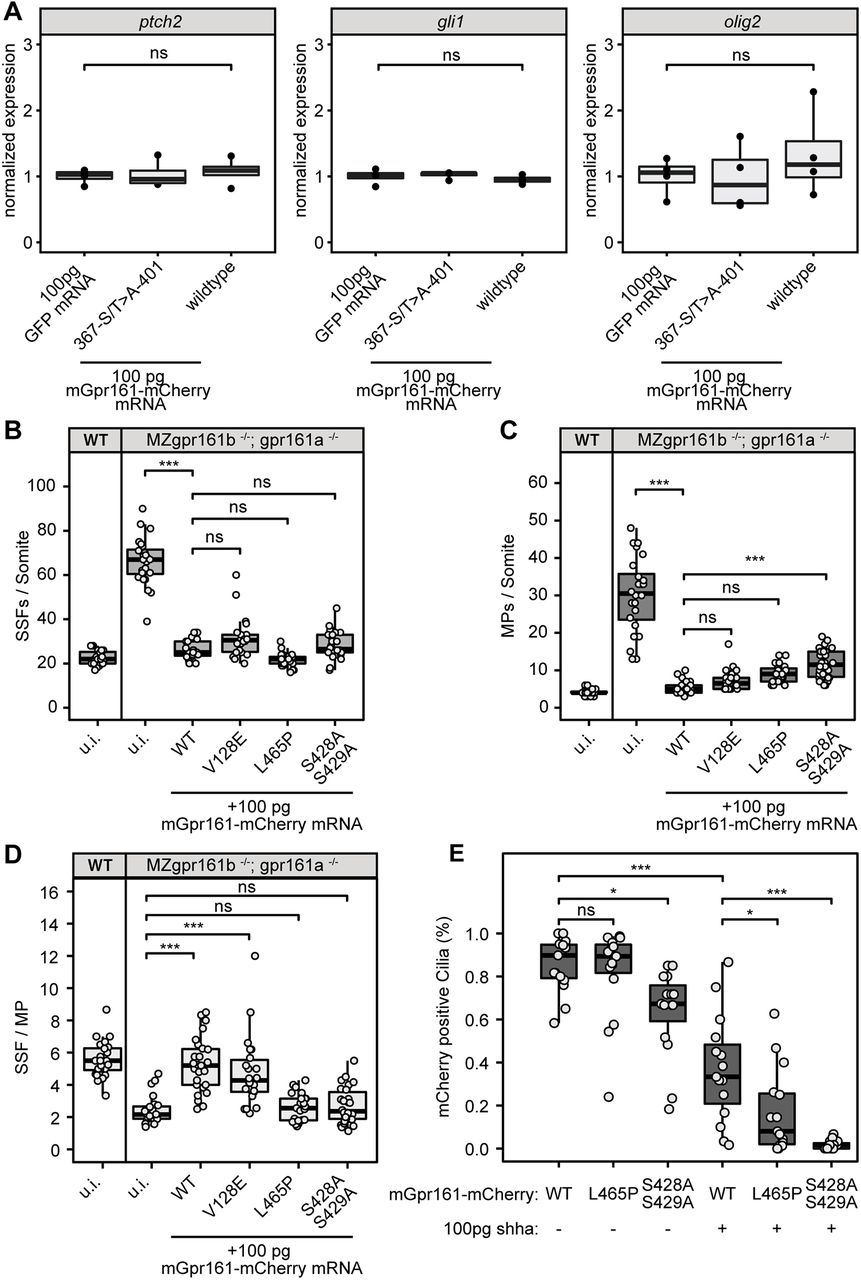
Fig. 5 Overexpression of mGpr161-mCherry in wild-type and MZgpr161b−/−; gpr161a−/− embryos. (A) Injections of 100 pg mGpr161376-S/T>A-401-mCherry or wild-type mGpr161-mCherry mRNA do not lead to an upregulation of the Hh-targets ptch2, gli1 or olig2 compared with control injections with 100 pg GFP mRNA (n=4; ns not significant, Kruskal–Wallis rank sum test). (B,C) Quantification of SSFs and MPs upon injection of different mGpr161 mRNAs into gpr161 mutants (n=22-27 somites in seven to nine embryos; ***P<0.001, *P<0.05; ns, not significant; one-way ANOVA, Tukey's post-hoc test for pairwise comparisons). Wild-type uninjected values are shown for comparison. (D) SSF/MP ratios within the somites quantified in B,C. (E) Quantification of mCherry-positive cilia at 9 hpf after injection of 100 pg mRNA of mGpr161-mCherry transcripts in response to co-injection of 100 pg shha mRNA (n=15 embryos from three experiments; ***P<0.001, *P<0.05; ns, not significant, two-way ANOVA, Tukey's post-hoc test for pairwise comparisons). Box plots show median values (centre lines) and the interquartile ranges (boxes); whiskers extend to the highest and lowest values within 1.5×IQR (inter-quartile range).