
- Title
-
Sound generation in zebrafish with Bio-Opto-Acoustics
- Authors
- Favre-Bulle, I.A., Taylor, M.A., Marquez-Legorreta, E., Vanwalleghem, G., Poulsen, R.E., Rubinsztein-Dunlop, H., Scott, E.K.
- Source
- Full text @ Nat. Commun.
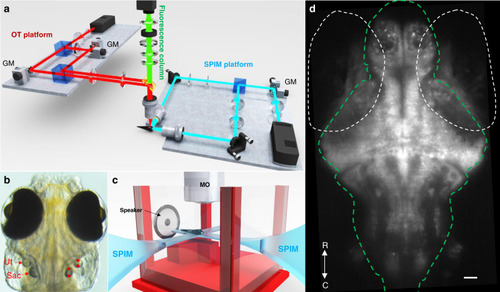
a Optical system comprising an OT platform for the generation of two optical traps, a SPIM platform for the illumination of a single plane of zebrafish brain, and a fluorescence column for the imaging of GCaMP6s emissions. Details can be found in the “Methods” section. b OT (red dots, right) were placed at two locations within the utricular (Ut) and saccular (Sac) otoliths. The galvo mirrors (GM) on the OT platform displaced each trap from one location to the other at a frequency ranging from 1 Hz to 1 kHz. c Sketch representing the placement of a larva in a custom-built-chamber, the SPIM planes, the microscope objective (MO), and the location of the speaker. d Example of a fluorescence image recorded from one plane in one fish. The white dashed ovals indicate the eyes, and the green line delineates the brain. R, rostral; C, caudal. Scale bar indicates 10 μm. |
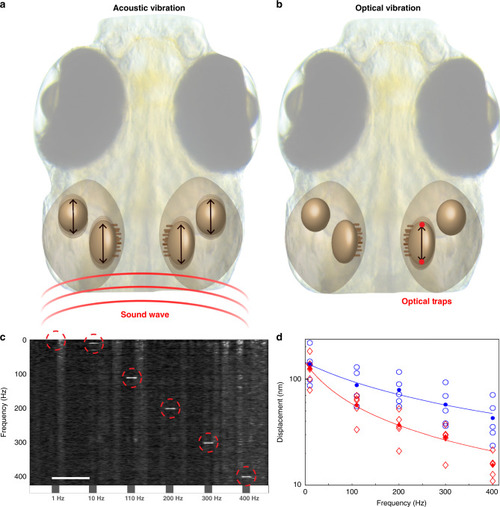
a Schematic illustration of sound propagation from a speaker and the resulting movements of the otoliths in larval zebrafish ear. b Illustration of OT targeted to alternating sides of one otolith at high speed, and the resulting selective vibration of the targeted otolith. c Average spectrogram (normalized over frequency) of the position of the optically manipulated otoliths (both saccule and utricle combined) over time across 5 fish. Gray boxes on the timeline represent 1 s of OT stimulation. The number written under the box represents the OT frequency of the stimulation. See Supplementary Figs. 2 and 3 for more details on the movements of each type of otolith. Scale bar in c is 5 s. Diffuse vertical bands are artefacts produced by animal movements, and movements of the otolith at 1 Hz stimulation are masked by background movements. d Individual measurements of otolith displacements at different frequencies of BOA stimulation (empty circles and diamonds), displayed on a logarithmic scale. Saccule data are represented in blue and utricle in red. Filled circles and diamonds represent mean values. Fit was performed to Eq. ( |
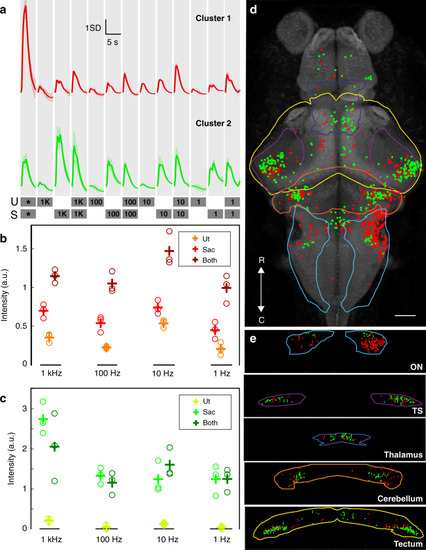
a The average profiles of two 100 Hz tone responsive clusters during acoustic and BOA stimulation. The two bottom lines detail the stimulus train. Gray boxes specify the stimulus windows (1 s of stimulation and 4 s of rest) and the otolith targeted (U, utricle; S, saccule). Numbers on the gray boxes specify the frequency of BOA stimulation in Hz. * represents a 100 Hz auditory tone from a speaker. |