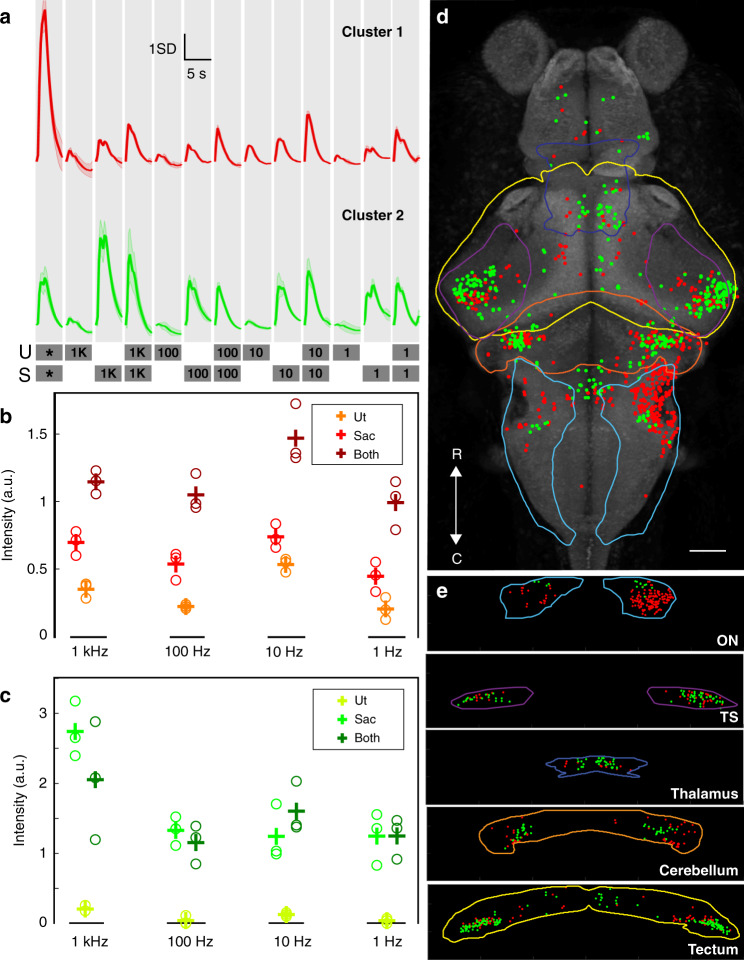
IMAGE

Fig. 3

ID
ZDB-IMAGE-201208-11
Source
Figures for Favre-Bulle et al., 2020
Image
Figure Caption

Fig. 3 Auditory and BOA responses across the brain.

a The average profiles of two 100 Hz tone responsive clusters during acoustic and BOA stimulation. The two bottom lines detail the stimulus train. Gray boxes specify the stimulus windows (1 s of stimulation and 4 s of rest) and the otolith targeted (U, utricle; S, saccule). Numbers on the gray boxes specify the frequency of BOA stimulation in Hz. * represents a 100 Hz auditory tone from a speaker. b, c Intensity of responses of cluster 1 (b) and cluster 2 (c) to BOA on the utricle (Ut), saccule (Sac), and both at various frequencies. Circles represent peak responses in individual trials (three in total for each OT configuration), with mean values shown by “+”. d Locations of ROIs belonging to two functional clusters of auditory neurons, viewed dorsally (red for cluster 1 and green for cluster 2). Brain regions of interest are outlined with colored lines, with light blue for octavolateralis nucleus (ON), purple for torus semicircularis (TS), dark blue for thalamus, orange for cerebellum, and yellow for tectum. Data are from six fish. Scale bars, 50 μm. R, rostral; C, caudal. e Distributions of each cluster in the brain regions outlined in d, rotated to produce a coronal view.

Acknowledgments
This image is the copyrighted work of the attributed author or publisher, and ZFIN has permission only to display this image to its users. Additional permissions should be obtained from the applicable author or publisher of the image. Full text @ Nat. Commun.