
Fig. 3
- ID
- ZDB-FIG-201208-9
- Publication
- Favre-Bulle et al., 2020 - Sound generation in zebrafish with Bio-Opto-Acoustics
- Other Figures
- All Figure Page
- Back to All Figure Page
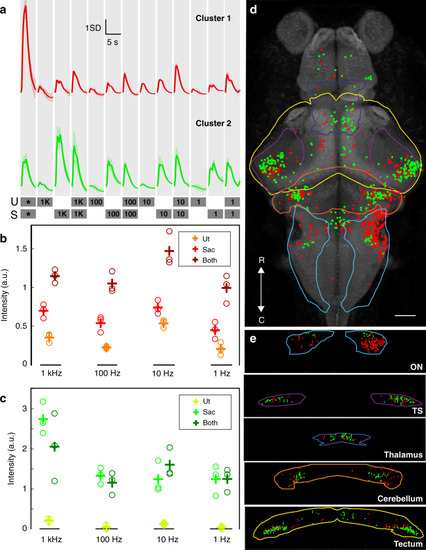
a The average profiles of two 100 Hz tone responsive clusters during acoustic and BOA stimulation. The two bottom lines detail the stimulus train. Gray boxes specify the stimulus windows (1 s of stimulation and 4 s of rest) and the otolith targeted (U, utricle; S, saccule). Numbers on the gray boxes specify the frequency of BOA stimulation in Hz. * represents a 100 Hz auditory tone from a speaker. |