
Fig. 1
- ID
- ZDB-FIG-201208-7
- Publication
- Favre-Bulle et al., 2020 - Sound generation in zebrafish with Bio-Opto-Acoustics
- Other Figures
- All Figure Page
- Back to All Figure Page
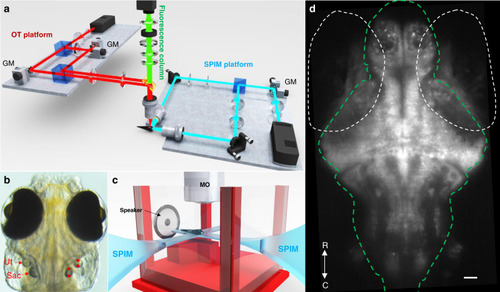
a Optical system comprising an OT platform for the generation of two optical traps, a SPIM platform for the illumination of a single plane of zebrafish brain, and a fluorescence column for the imaging of GCaMP6s emissions. Details can be found in the “Methods” section. b OT (red dots, right) were placed at two locations within the utricular (Ut) and saccular (Sac) otoliths. The galvo mirrors (GM) on the OT platform displaced each trap from one location to the other at a frequency ranging from 1 Hz to 1 kHz. c Sketch representing the placement of a larva in a custom-built-chamber, the SPIM planes, the microscope objective (MO), and the location of the speaker. d Example of a fluorescence image recorded from one plane in one fish. The white dashed ovals indicate the eyes, and the green line delineates the brain. R, rostral; C, caudal. Scale bar indicates 10 μm. |