
|
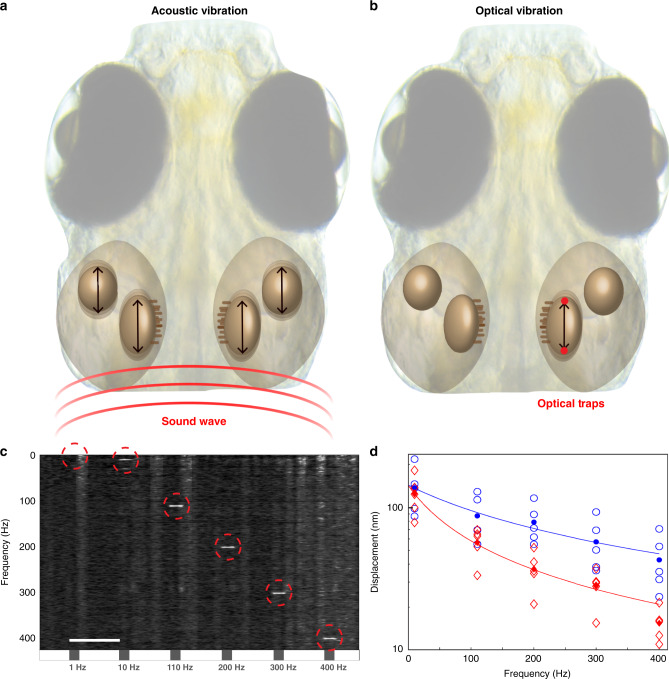
Fig. 2
a Schematic illustration of sound propagation from a speaker and the resulting movements of the otoliths in larval zebrafish ear. b Illustration of OT targeted to alternating sides of one otolith at high speed, and the resulting selective vibration of the targeted otolith. c Average spectrogram (normalized over frequency) of the position of the optically manipulated otoliths (both saccule and utricle combined) over time across 5 fish. Gray boxes on the timeline represent 1 s of OT stimulation. The number written under the box represents the OT frequency of the stimulation. See Supplementary Figs. 2 and 3 for more details on the movements of each type of otolith. Scale bar in c is 5 s. Diffuse vertical bands are artefacts produced by animal movements, and movements of the otolith at 1 Hz stimulation are masked by background movements. d Individual measurements of otolith displacements at different frequencies of BOA stimulation (empty circles and diamonds), displayed on a logarithmic scale. Saccule data are represented in blue and utricle in red. Filled circles and diamonds represent mean values. Fit was performed to Eq. (