
- Title
-
Zebrafish Posterior Lateral Line primordium migration requires interactions between a superficial sheath of motile cells and the skin
- Authors
- Dalle Nogare, D.E., Natesh, N., Vishwasrao, H.D., Shroff, H., Chitnis, A.B.
- Source
- Full text @ Elife
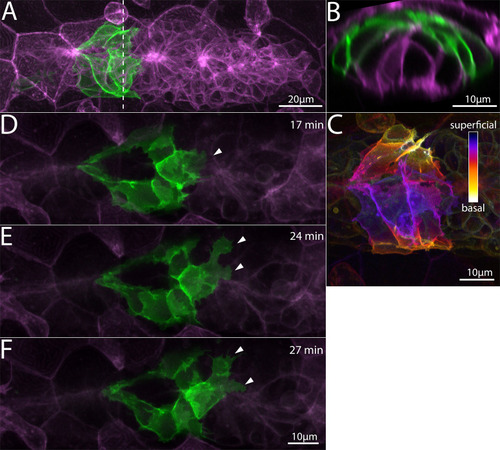
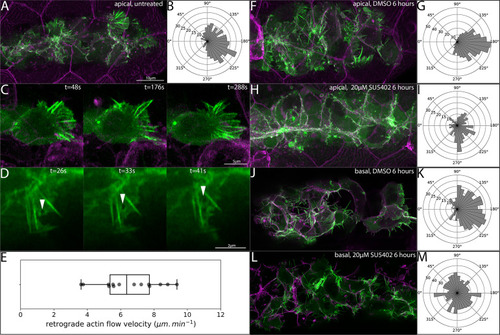
Z-projection of a timelapse video of |
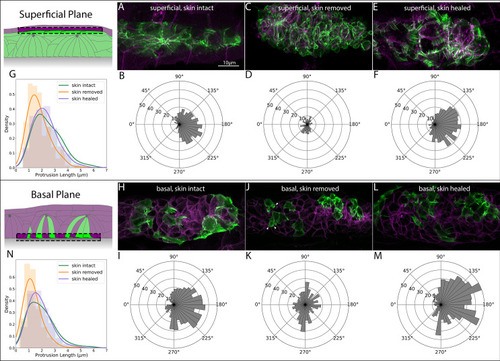
Two cells of each class (leading, protoneuromast, superficial) are shown. Relative positions in the PLLp are shown in the bottom panel. Enlargements of each cell are shown above from each orthogonal view (corresponding to the colored arrows in the bottom panel). |
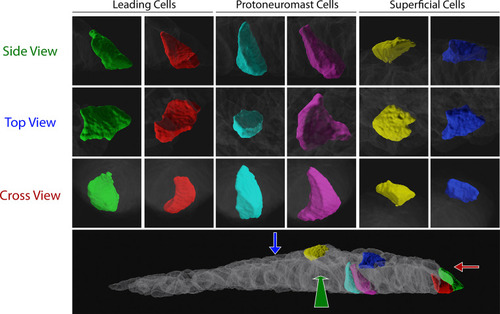
Two cells of each class (leading, protoneuromast, superficial) are shown. Relative positions in the PLLp are shown in the bottom panel. Enlargements of each cell are shown above from each orthogonal view (corresponding to the colored arrows in the bottom panel). |
( |
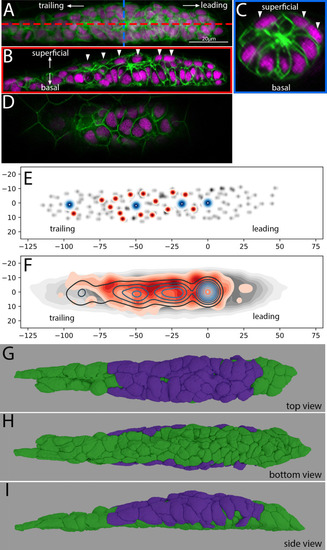
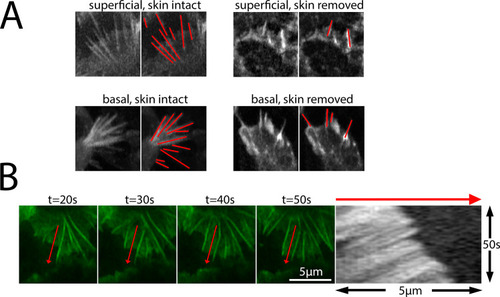
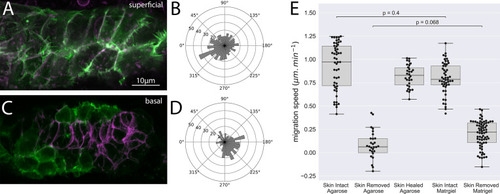
Z-projection of a timelapse video taken adjacent to the skin in |
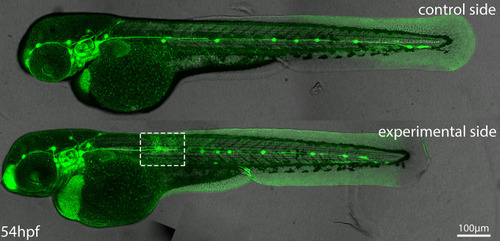
Top panel shows control (unmanipulated) and bottom panel shows experimental (skin removed) side of the same embryo. Images are maximum-intensity projected stitched confocal stacks overlaid with DIC images. |
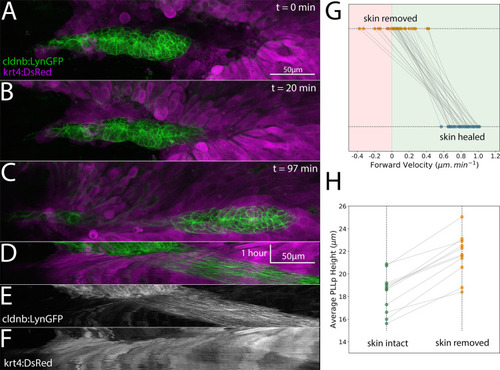
Top panel shows control (unmanipulated) and bottom panel shows experimental (skin removed) side of the same embryo. Images are maximum-intensity projected stitched confocal stacks overlaid with DIC images. |
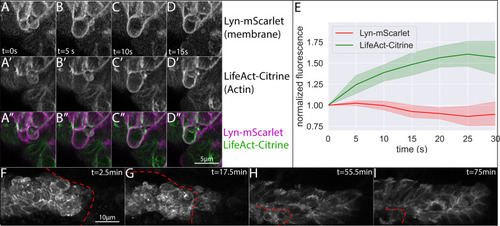
Z-projection of a timelapse video of |
( |
( |
( |