FIGURE

Figure 2—figure supplement 2.

ID
ZDB-FIG-201202-25
Publication
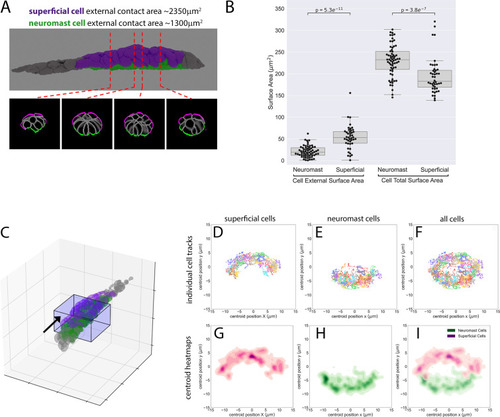
Dalle Nogare et al., 2020 - Zebrafish Posterior Lateral Line primordium migration requires interactions between a superficial sheath of motile cells and the skin
Other Figures
All Figure Page
Back to All Figure Page
Figure 2—figure supplement 2.

Surface area contacts and position of superficial cells in the Zebrafish Posterior Lateral Line primordium.

(A) Top panel: 3D rendering of PLLp. Superficial cells in magenta, protoneuromast cells in green and all other cells in gray. Bottom panels: Cross sections at the positions indicated in A showing internal PLLp cell boundaries in gray, and external cell boundaries in either magenta (for superficial cells) or green (for protoneuromast cells). (B) Boxplot of external (first two columns) and total surface area size (second two columns) for superficial and protoneuromast cells from the segmented PLLp shown in A. p-values are Mann-Whitney nonparametric U test. (C) 3D rendering of all segmented nuclei in the PLLp at t = 0 from Figure 2—video 2A. Box represents all nuclei within 40 µm (lengthwise) of the central protoneuromast in the PLLp, and includes the nuclei tracked in panels B-F. (D–F) Cross-section projections of the boxed area in A (from the perspective of the black arrow), showing each individual nuclear centroid track in a different color over 120 1-min timepoints (2 hr total). (D) Superficial nuclei tracks. (E) Protoneuromast nuclear tracks. (F) All nuclear tracks. (G–I) Heatmaps of the centroid positions of the nuclei in D-F, colored by whether the nucleus belongs to a superficial (magenta) or protoneuromast (green) cell (see panel A). To generate cross-section tracks in D-F, nuclear positions were normalized to the central apical constriction of the protoneuromast (which lies at 0,0 in all of the plots) to correct for migration of the primordium in the (X and Y plane), and a small rotation (~10° counter-clockwise) was imposed to compensate for asymmetries in the time-lapse data acquisition. See also Figure 2—video 2 for more details.

Expression Data

Expression Detail
Antibody Labeling
Phenotype Data

Phenotype Detail
Acknowledgments
This image is the copyrighted work of the attributed author or publisher, and ZFIN has permission only to display this image to its users. Additional permissions should be obtained from the applicable author or publisher of the image. Full text @ Elife