
IMAGE
Figure 2—figure supplement 1.
- ID
- ZDB-IMAGE-201202-23
- Source
- Figures for Dalle Nogare et al., 2020
Image
|
Figure Caption
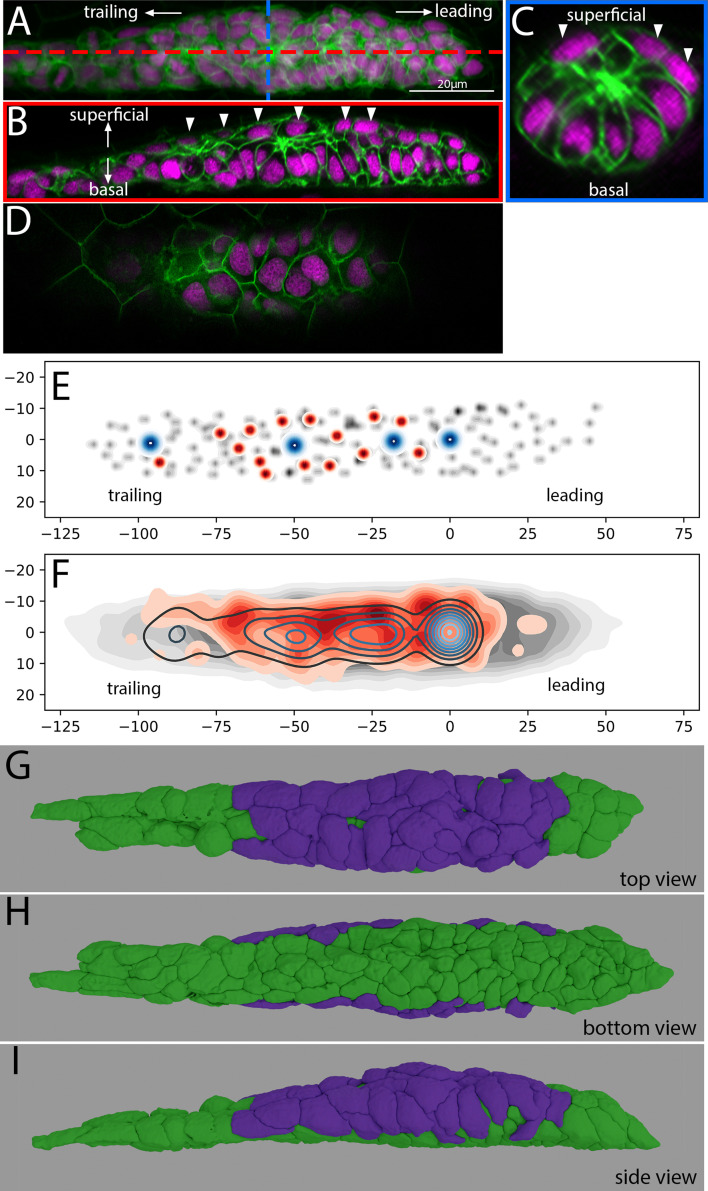
Figure 2—figure supplement 1.
Two cells of each class (leading, protoneuromast, superficial) are shown. Relative positions in the PLLp are shown in the bottom panel. Enlargements of each cell are shown above from each orthogonal view (corresponding to the colored arrows in the bottom panel).
Acknowledgments
This image is the copyrighted work of the attributed author or publisher, and
ZFIN has permission only to display this image to its users.
Additional permissions should be obtained from the applicable author or publisher of the image.
Full text @ Elife