Image
Figure Caption

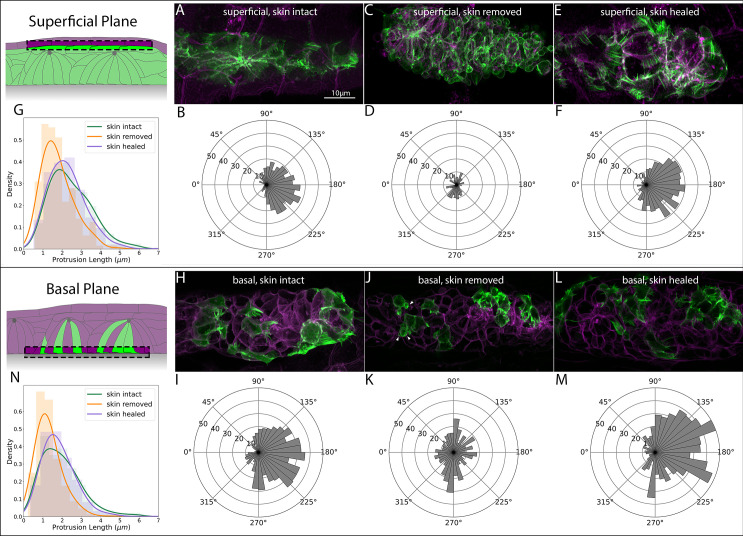
Figure 6—figure supplement 1. Examples of protrusions measured for direction and length quantification in <xref rid='fig3' ref-type='fig'>Figures 3</xref>, <xref rid='fig6' ref-type='fig'>6</xref> and <xref rid='fig7' ref-type='fig'>7</xref>.

(A) Examples of superficial and basal protrusions in both skin-intact and skin-removed conditions. All protrusions were measured from time-lapse images where the direction of protrusion extension and maximal extension length could be quantified. (B) example kymograph used for quantification of retrograde actin flow. Left panels represent single frames from time-lapse video. Red arrow indicates the position sampled for the kymograph (right).

Acknowledgments
This image is the copyrighted work of the attributed author or publisher, and ZFIN has permission only to display this image to its users. Additional permissions should be obtained from the applicable author or publisher of the image. Full text @ Elife