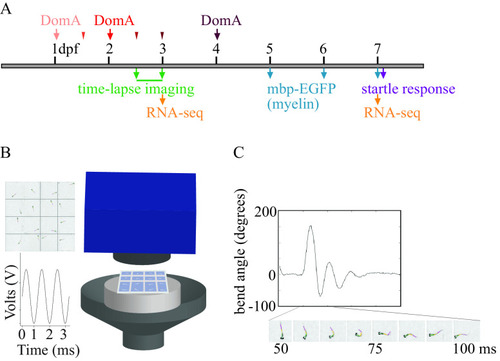
Experimental setup. (A) Exposure paradigm and end points assessed during zebrafish development. Domoic acid (DomA) was intravenously microinjected at one developmental time. Arrows indicate the three developmental time points that were used across all experiments [1, 2, and 4 d postfertilization (dpf)]. Thinner arrowheads represent other developmental time points at which DomA was injected in selected experiments (1.5, 2.5, and 3 dpf). For each injection category, the associated ranges of injection times in hours postfertilization (hpf) were: 1 dpf (28–32.5 hpf), 1.5 dpf (35.5–39 hpf), 2 dpf (47–53 hpf), 2.5 dpf (60–64 hpf), 3 dpf (71–77 hpf), and 4 dpf (99–105.5 hpf). Mortality, morphological defects, the presence or absence of convulsions, pectoral flapping, and touch responses were recorded daily from the day after exposure to 5 dpf. (B) Apparatus used to assess startle responses to auditory/vibrational stimuli. A speaker with a bonded platform was sent a 3-ms, 1,000-Hz pulse, which was then delivered to a 16-well plate. A high-speed camera captured startle responses at 1,000 frames per second. (See the section “Equipment” in the Supplemental Material.) (C) Sample trace of the bend angle over time as a larva undergoes startle. Bend angle is estimated by measuring the changes in angles between three line segments that outline the larvae.

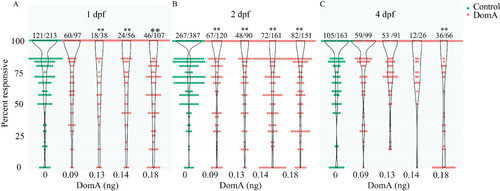
Startle responsiveness in zebrafish exposed to domoic acid (DomA) at 1, 2, and 4 d postfertilization (dpf). Fish were exposed to different doses of DomA at (A) 1 dpf, (B) 2 dpf, or (C) 4 dpf, and startle responses were measured at 7 dpf. Points represent the percentage response of individual fish to replicate stimuli. Ratios listed above represent the number of fish that responded to 100% of the stimuli over the total number of fish tested per treatment group. Violin plots are overlaid to show kernel density distribution of the data. Significance was determined with post hoc pairwise Dunnett comparisons following binomial modeling of percentage responsiveness. p-Values indicate significant differences in responsiveness in DomA-exposed larvae compared with controls injected with saline during the same developmental time period (*, p<0.05; **, p<0.005). Responsiveness data from nine trials were combined. See Table S10 for data.

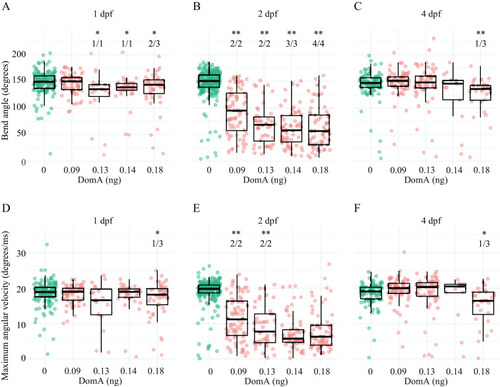
Kinematics for short latency C-bend (SLC) startles in zebrafish exposed to domoic acid (DomA) at 1, 2, and 4 d postfertilization (dpf). Fish were exposed to different doses of DomA at (A,D) 1 dpf, (B,E) 2 dpf, and (C,F) 4 dpf, and startle responses were measured at 7 dpf. SLC startle responses were characterized by (A–C) bend angle and (D–F) maximal angular velocity. Each point represents the median of up to seven responses for an individual fish. Box plots show the group medians, upper 75% quantiles, and lower 25% quantiles. Significance was determined using Behrens-Fisher t-tests (for trials with one DomA dose) or using nonparametric multiple comparison procedures with Dunnett-type contrasts (for trials with multiple DomA doses). Asterisks represent statistical significance between DomA and controls within a single trial (*, p<0.05; **, p<.001). The numbers shown above each column represent the number of trials with statistically significant treatment effects/the total number of trials conducted. Tables S11, S14, and S16 contain the results from the statistical analysis for 2 dpf-, 1 dpf-, and 4 dpf-injected fish, respectively. Table S13 includes medians and interquartile ranges for 2 dpf-injected fish.

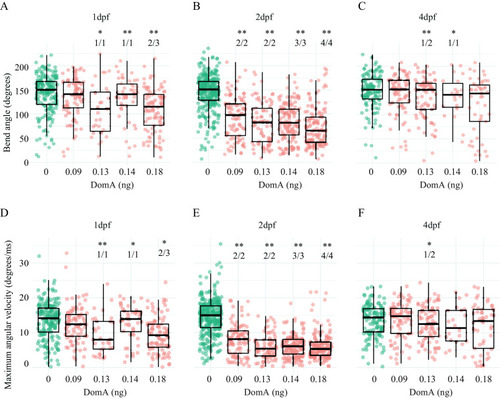
Kinematics for long latency C-bend (LLC) startles in zebrafish exposed to domoic acid (DomA) at 1, 2, and 4 d postfertilization (dpf). Fish were exposed to different doses of DomA at (A,D) 1 dpf, (B,E) 2 dpf, and (C,F) 4 dpf, and startle responses were measured at 7 dpf. LLC startle responses were characterized by (A–C) bend angle and (D–F) maximal angular velocity. Each point represents the median of up to seven responses for an individual fish. Box plots show the group medians, upper 75% quantiles, and lower 25% quantiles. Significance was determined using Behrens-Fisher t-tests (for trials with one DomA dose) or using nonparametric multiple comparison procedures with Dunnett-type contrasts (for trials with multiple DomA doses), Asterisks represent statistical significance between DomA and controls within a single trial. (*, p<0.05; **, p<.001). The numbers shown above each column represent the number of trials with statistically significant treatment effects/the total number of trials conducted. Tables S12, S15, and S17 contain the results from the statistical analysis for 2 dpf-, 1 dpf-, and 4 dpf-injected fish, respectively. Table S13 includes medians and interquartile ranges for 2 dpf-injected fish.

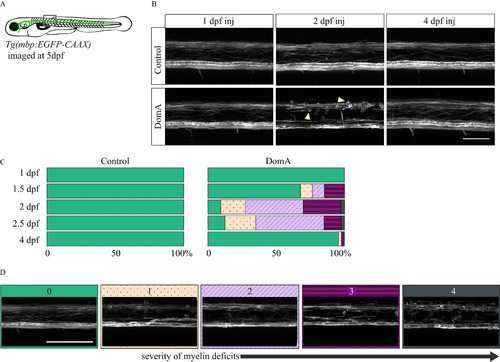
Confocal imaging of myelin sheath structures of zebrafish exposed to domoic acid (DomA) at different developmental days (A) Tg(mbp:EGFP-CAAX) fish were used to visualize labeled myelin sheaths. (B) Representative images of fish exposed to DomA (0.130.14 ng) during discrete periods in early development [1–4 d postfertilization (dpf)], then imaged at 5 dpf using confocal microscopy. Arrows indicate the unusual circular membrane profiles. (C) Stacked bar plots show the distribution of the different myelin phenotypes when fish were exposed to DomA at discrete developmental times. Multiple trials were combined to calculate the percentage distribution per phenotype observed. (D) Representative confocal microscopy images of different myelin phenotypes that were observed. Each fish was blindly classified and assigned a category based on the severity of the myelin deficit observed. The scoring was as described in detail in Figure S2. Briefly, the classification was as follows: (0) normal phenotype, (1) myelin sheaths present but disorganized, (2) myelin with noticeable deficits, (3) myelin gaps in ventral spinal cord, and (4) myelin sheaths lacking in ventral spinal cord. Scale bar: 50μm (Figure 5B) and 100μm (Figure 5D). Table S20 includes the number of trials represented along with the associated numbers of fish per trial.

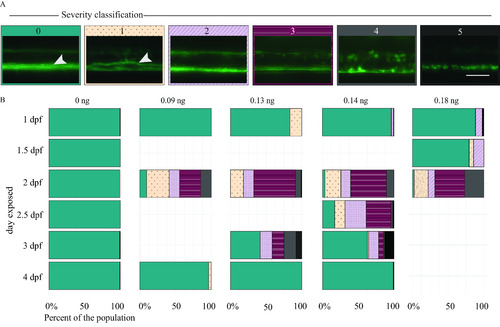
Myelin sheaths of zebrafish at 5 d postfertilization (dpf) following exposure to domoic acid (DomA) at different developmental days. (A) Tg(mbp:EGFP-CAAX) fish were exposed to DomA (0.090.18 ng) over a range of discrete developmental periods (1–4 dpf), then imaged at 5 dpf using widefield epifluorescence microscopy. Images were blindly classified into six categories based on the severity of the observed myelin phenotype. The scoring was as described in detail in Figure S2. Briefly, the classification was as follows: (0) normal phenotype, (1) myelin sheaths present but disorganized, (2) myelin with noticeable deficits, (3) myelin gaps in ventral spinal cord, (4) myelin sheaths lacking in ventral spinal cord, and (5) visible sloughed myelin. Arrows indicate the myelinated Mauthner axon that is required for short latency C-bends startle responses. (B) Stacked bar plots show the distribution of the different phenotypes. Multiple trials were combined to calculate the percentage distribution per phenotype observed. Scale bar: 50μm Table S21 includes the number of trials represented along with the associated numbers of fish per trial. Table S22 includes the myelin phenotype classification by dose and day injected. Table S24 contains the output of the multinomial logistic regression model to assess the role of developmental day of exposure on the distribution of myelin phenotypes. Table S29 contains the output of the multinomial logistic regression model for the influence of dose on the distribution of myelin phenotypes.

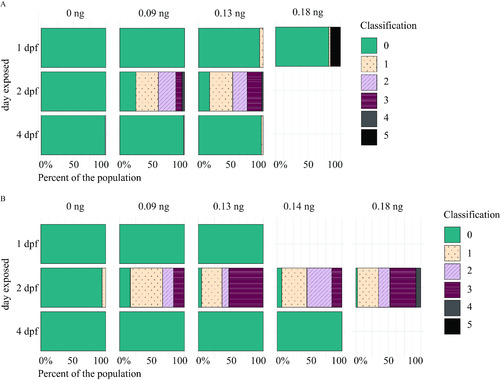
Myelin sheaths of zebrafish at 6 and 7 d postfertilization (dpf) following exposure to domoic acid (DomA) at different developmental days. Tg(mbp:EGFP-CAAX) fish were exposed to DomA over discrete developmental periods (1, 2, and 4 dpf), then imaged at (A) 6 dpf and (B) 7 dpf using widefield epifluorescence microscopy. Images were blindly classified into six categories based on the severity of the observed myelin phenotype. The scoring was as described in detail in Figure S2. Briefly, the classification was as follows: (0) normal phenotype, (1) myelin sheaths present but disorganized, (2) myelin with noticeable deficits, (3) myelin gaps in ventral spinal cord, (4) myelin sheaths lacking in ventral spinal cord, and (5) visible sloughed myelin. Stacked bar plots show the distribution of the different phenotypes per each dose. Data from individual fish from multiple trials were combined to calculate the percentage distribution per phenotype observed. Tables S25 and S27 contain the number of trials and associated numbers of fish per trial for 6 dpf- (A) and 7 dpf-injected fish (B), respectively. Table S26 includes myelin phenotype classification by dose and day injected, with imaging at 6 dpf. Table S28 includes myelin phenotype classification by DomA dose and day injected, with imaging at 7 dpf. Table S29 contains the output of the multinomial logistic regression model for the influence of dose on the distribution of myelin phenotypes.

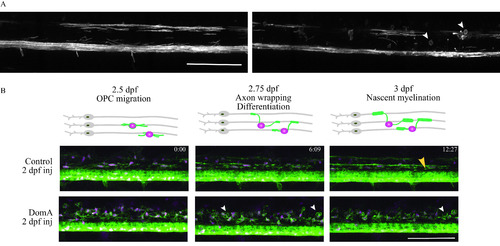
Time-lapse imaging of myelin sheath formation in zebrafish exposed to domoic acid (DomA) at 2 d postfertilization (dpf). (A) Tg(mbp:EGFP-CAAX) fish were used to visualize labeled myelin sheaths. Shown are representative images of DomA-exposed (0.14 ng) (right panel), and control larvae (left panel) that were exposed at 2 dpf and imaged at 3 dpf. White arrowheads denote the aberrant circular protrusions found in DomA-exposed larvae (control, n=5; DomA, n=10). (B) Stills from time-lapse imaging of a representative control and DomA-exposed transgenic fish [Tg(nkx2.2:mEGFP)×Tg(sox10:RFP)] from 2.5–3 dpf. Time stamps (hour:minutes) show the time elapsed. Diagrams above the images show the key developmental processes in the oligodendrocyte lineage during this time range (representative time-lapse image of control, n=5 and DomA, n=6). Large yellow arrowhead denotes an elongated myelin sheath. Small white arrowheads denote unusual circular myelin membranes. Scale bar: 100μm. Stills (B) were from a time lapse of control (Video S2) and DomA-exposed fish (Video S3).

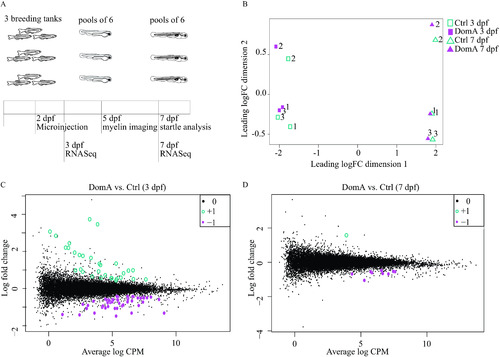
Transcriptional changes associated with domoic acid (DomA) exposure at 2 d postfertilization (dpf). (A) Experimental design. Tanks of three adult fish (2 females, 1 male) of Tg(mbp:EGFP-CAAX) background were bred and the embryos exposed to DomA (0.14 ng) or vehicle at 2 dpf. Pools of six embryos within a given treatment from each tank were then sampled at 3 and 7 dpf for RNA sequencing. Three pools per treatment represented the three biological replicates. For functional analyses, myelin sheath labeling was assessed at 5 dpf and startle response was assessed at 7 dpf prior to RNA sequencing. The results confirming differences in behavior and myelin labeling between DomA-exposed fish and controls used for RNA sequencing are shown in Figure S6. (B) A multidimensional scaling plot shows clustering of samples based on overall differences in expression profiles. (C,D) Mean-difference plots compare the log fold changes of genes in DomA-exposed vs. control fish at the 3 dpf- and 7 dpf-sampling times. Hollow teal circles (+1) represent genes that were significantly up-regulated in DomA-exposed fish relative to their controls, whereas filled magenta circles (1) represent genes that were significantly down-regulated in DomA-exposed fish relative to their controls. Significance was determined with a genewise negative bionomial generalized linear model with a quasi-likelihood test. p-Values were adjusted for using a 5% false discovery rate cutoff. Tables S30 and S31 contain the results of the functional enrichment analysis done using the differentially expressed genes shown in (C). Excel Table S1 contains the list of genes that were differentially expressed in DomA-exposed fish at 3 dpf, and Excel Table S2 contains the list of genes that were differentially expressed in DomA-exposed fish at 7 dpf. Note: CPM, counts per million; FC, fold change.

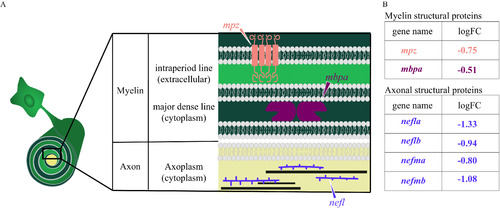
Diagram of myelin and axonal structural proteins differentially expressed in domoic acid (DomA)-exposed fish. (A) Schematic of the cross section of an axon–myelin interface with a focus on selected myelin and axon structural proteins that are differentially expressed in DomA-exposed fish at 3 d postfertilization. The magnified cross section shows the major divisions in myelin (Barkovich 2000): first, major dense line: the electron-dense cytoplasm where myelin basic protein (encoded by the mbp gene) attaches to the inner surface of the membrane proteins and stabilizes myelin, and second, the intraperiod line, the less electron-dense extracellular space. Transmembrane proteins like myelin protein zero (encoded by the mpz gene) maintains compact myelin structure through its cytoplasmic and extracellular interactions. The cross section also shows a simplified axoplasm that contains neurofilaments that form part of the axon cytoskeleton. (B) Myelin and structural proteins that are differentially expressed, with their log fold change (logFC). –, gene was down-regulated in DomA-exposed fish relative to controls.

Acknowledgments
This image is the copyrighted work of the attributed author or publisher, and ZFIN has permission only to display this image to its users. Additional permissions should be obtained from the applicable author or publisher of the image. Full text @ Environ. Health Perspect.