
- Title
-
MYH3-associated distal arthrogryposis zebrafish model is normalized with para-aminoblebbistatin
- Authors
- Whittle, J., Antunes, L., Harris, M., Upshaw, Z., Sepich, D.S., Johnson, A.N., Mokalled, M., Solnica-Krezel, L., Dobbs, M.B., Gurnett, C.A.
- Source
- Full text @ EMBO Mol. Med.
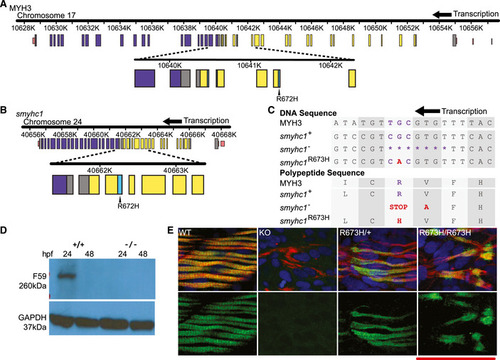
Schematic to scale of human MYH3 gene on chromosome 17. Noncoding regions are displayed in pink. Coiled coil domain (840–1,933 bp) displayed in purple. Motor domain (86–779 bp) displayed in yellow. Actin binding site (656–678/758–772 bp) shown in cyan. Location of R672H mutation is enlarged and labeled. Schematic to scale of zebrafish Aligned DNA and amino acid sequences of Western blot of whole zebrafish larvae, Smyhc1 stained with the F59 antibody. Smyhc1 immunohistochemistry stain of 24 hpf (hour postfertilization) zebrafish larvae. Filamentous actin is stained with phalloidin (red). Nuclei are stained with DAPI (blue). Smyhc1 is stained with the F59 antibody (green) (Elworthy |
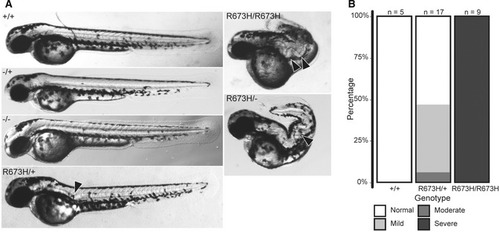
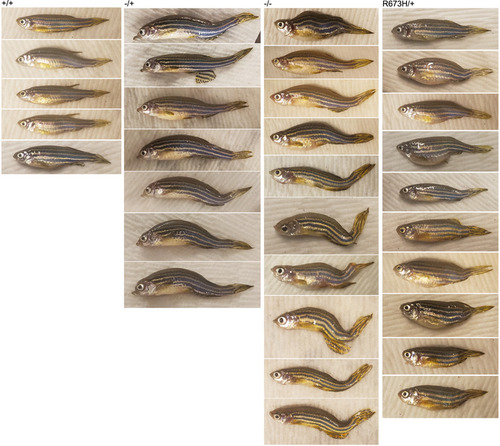
Morphologies of Quantification of PHENOTYPE:
|
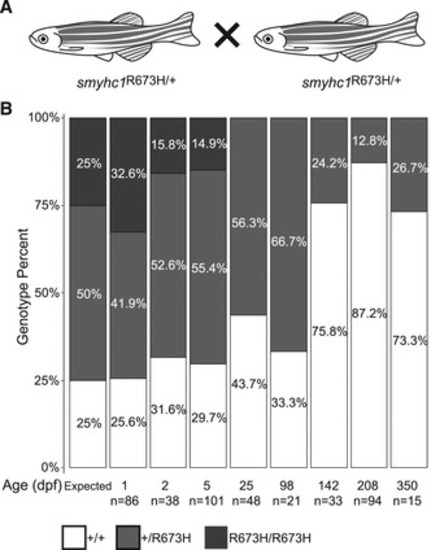
Schema of in‐crosses used to generate clutches for survival assay. The predicted mendelian (1:2:1) and experimental ratio of genotypes of progeny from |
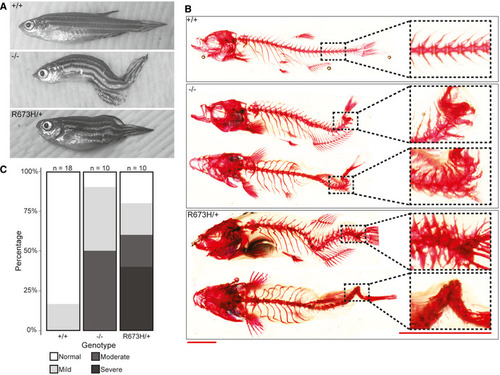
Gross morphology of Alizarin red staining of bone shows spinal curvature but no bony fusions in the skeleton of Quantification of skeletal phenotype severity in adults. Representative examples of fish in each of the four phenotypic groups (normal, mild, moderate, and severe) are shown in Fig PHENOTYPE:
|
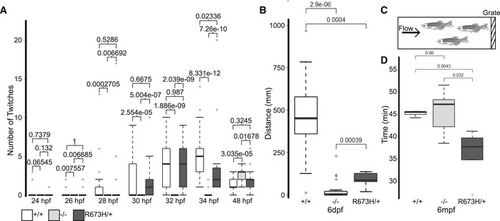
Time course of light‐triggered larval movements was manually counted at indicated times between 24 and 48 hpf. The Distance traveled during 5 min of spontaneous swimming at 6 dpf quantified by motion tracking software (Noldus Ethovision). At 6 dpf, both Diagram of swim tunnel used to quantify adult swimming behavior. Water flow was gradually increased until the fish fatigued and were collected at the grate. Time spent swimming in swim tunnel before fatigue in adults at 6 months postfertilization (mpf). |
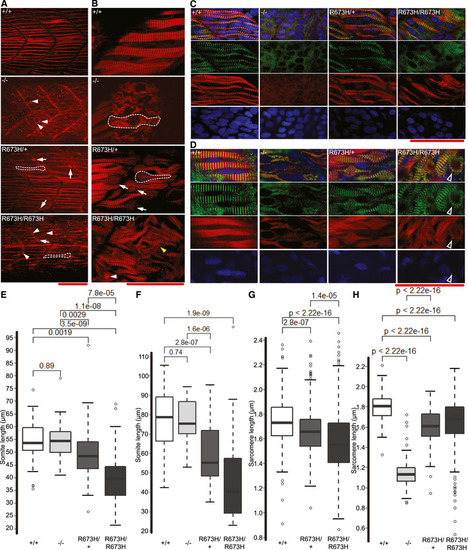
Confocal fluorescence images of slow skeletal muscle of 1 dpf larvae, stained with phalloidin‐rhodamine to detect actin. Puncta of filamentous actin are indicated with white arrowheads, and misshapen myofibers are indicated with white arrows and outlined. Confocal microscope fluorescence images of slow skeletal muscle of 3 dpf larvae, stained with phalloidin‐rhodamine. Puncta of filamentous actin are indicated with white arrowheads, distorted myofibers are indicated with arrows and outlined, and frayed myofibers are indicated with yellow arrowhead. Confocal fluorescence images of slow skeletal muscle of 1 dpf larvae, stained with phalloidin‐rhodamine (red), anti‐α‐actinin antibodies (green), and DAPI (blue). Confocal fluorescence images of slow skeletal muscle of 3 dpf larvae, stained with phalloidin‐rhodamine (red), anti‐α‐actinin antibodies (green), and DAPI (blue). Bundle of actin ringed with α‐actinin indicated with white‐bordered black arrowhead. Myoseptal intervals of slow skeletal muscle at 1 dpf in Myoseptal intervals of slow skeletal muscle at 3 dpf in Z‐disk intervals (sarcomere length) of slow skeletal muscle at 1 dpf in Z‐disk intervals (sarcomere length) of slow skeletal muscle at 3 dpf in EXPRESSION / LABELING:
PHENOTYPE:
|
Representative morphologies of Representative images of PHENOTYPE:
|
Smyhc1 immunohistochemistry stain of 3 dpf zebrafish larvae. Filamentous actin is stained with phalloidin (red). Nuclei are stained with DAPI (blue). Smyhc1 is stained with the F59 antibody (green) (Elworthy Data Information: Scale bar represents a length of 50 μm. |
|
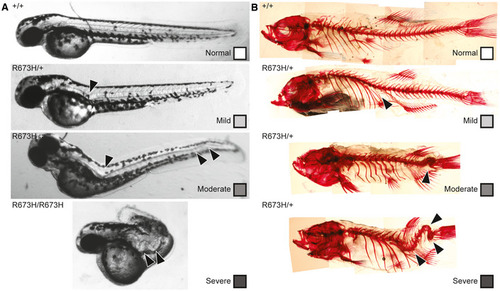
Grading scale for 2 dpf embryos. Normal is classified as 0 visible abnormalities, mild is classified as 1 notochord curve or kink, moderate is classified as multiple notochord curves or kinks, and severe is classified as multiple notochord kinks that severely distort the body. Arrowheads indicate notochord abnormalities. Grading scale for adult skeletal abnormalities. Normal is classified as 0 visible abnormalities, mild is classified as 1 spinal curve or kink, moderate is classified as multiple spinal curves or kinks, or apparent vertebral fusion, and severe is classified as multiple spinal kinks or vertebral fusions that severely distort the body. Arrowheads indicate spinal abnormalities. |
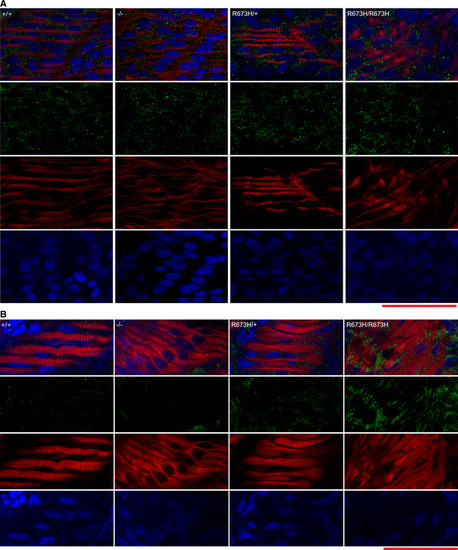
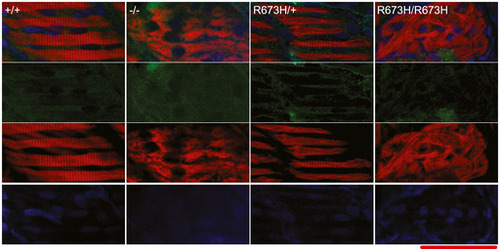
Confocal fluorescence images of slow skeletal muscle of 1 dpf larvae, stained with phalloidin‐rhodamine (red), Caspase‐3 antibodies (green), and DAPI (blue). Confocal fluorescence images of slow skeletal muscle of 3 dpf larvae, stained with phalloidin‐rhodamine (red), Caspase‐3 antibodies (green), and DAPI (blue). |
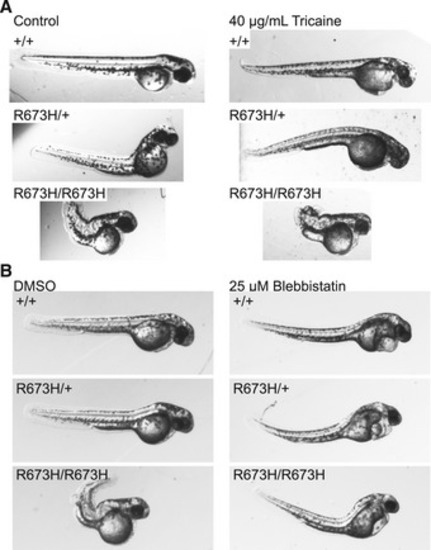
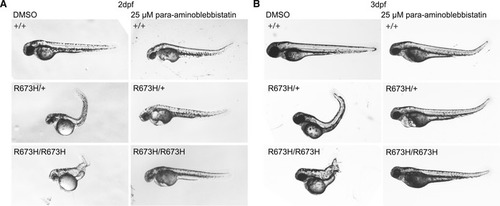
Zebrafish embryos (2 dpf) treated with 40 mg/ml tricaine methanylsulfonate or control egg medium for 24 h starting at 1 dpf. Tricaine suppressed movement but failed to normalize notochord kinks and bends. Tricaine appears to have no major effect on anatomy. Zebrafish embryos (2 dpf) were treated with 25 μM blebbistatin or DMSO control for 24 h starting at 1 dpf. Blebbistatin appears to partially rescue |