FIGURE

Figure 5

ID
ZDB-FIG-201116-14
Publication
Whittle et al., 2020 - MYH3-associated distal arthrogryposis zebrafish model is normalized with para-aminoblebbistatin
Other Figures
All Figure Page
Back to All Figure Page
Figure 5

Motor deficits in <italic>smyhc1</italic> mutants are variable during development

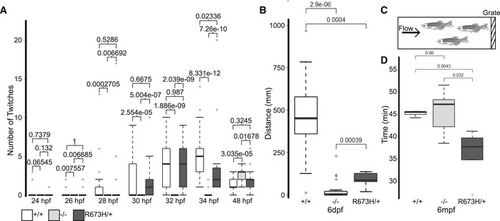
Time course of light‐triggered larval movements was manually counted at indicated times between 24 and 48 hpf. The smyhc1−/− larvae (n = 36) were paralyzed up to 48 hpf. smyhc1R673H/+ mutants (n = 15) twitched slightly less than their smyhc1+/+ siblings (n = 21) at 34 hpf. The central bands of the boxplots represent the median, the boxes of the boxplots represent the interquartile range (between the first and third quartile), and the whiskers represent the minimum and maximum values, up to 1.5 times the interquartile range. Outliers displayed are outside of this range.

Distance traveled during 5 min of spontaneous swimming at 6 dpf quantified by motion tracking software (Noldus Ethovision). At 6 dpf, both smyhc1−/− (n = 24) and smyhc1R673H/+ (n = 11) larvae traveled significantly less than smyhc1+/+ larvae (n = 13). The central bands of the boxplots represent the median, the boxes of the boxplots represent the interquartile range (between the first and third quartile), and the whiskers represent the minimum and maximum values, up to 1.5 times the interquartile range. Outliers displayed are outside of this range.

Diagram of swim tunnel used to quantify adult swimming behavior. Water flow was gradually increased until the fish fatigued and were collected at the grate.

Time spent swimming in swim tunnel before fatigue in adults at 6 months postfertilization (mpf). smyhc1+/+ (n = 6), smyhc1−/− (n = 5), smyhc1R673H/+ (n = 5).

Data Information: Wilcoxon rank‐sum test used to calculate significance. P‐values comparing each group displayed above data. The central bands of the boxplots represent the median, the boxes of the boxplots represent the interquartile range (between the first and third quartile), and the whiskers represent the minimum and maximum values, up to 1.5 times the interquartile range. Outliers displayed are outside of this range.

Expression Data

Expression Detail
Antibody Labeling
Phenotype Data
Fish:
Observed In:
Stage Range: Prim-15 to Adult

Phenotype Detail
Acknowledgments
This image is the copyrighted work of the attributed author or publisher, and ZFIN has permission only to display this image to its users. Additional permissions should be obtained from the applicable author or publisher of the image. Full text @ EMBO Mol. Med.