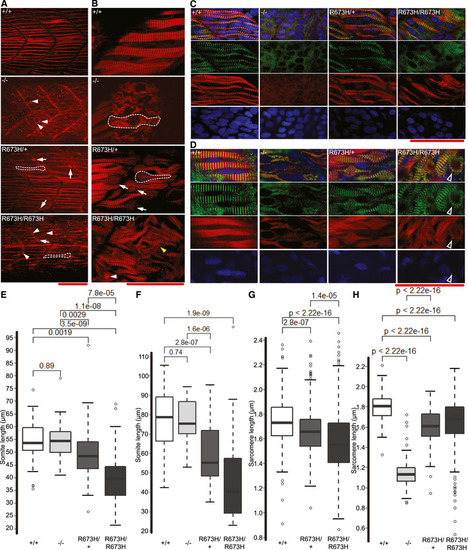
Slow skeletal muscle disorganization of <italic>smyhc1</italic> mutants
Confocal fluorescence images of slow skeletal muscle of 1 dpf larvae, stained with phalloidin‐rhodamine to detect actin. Puncta of filamentous actin are indicated with white arrowheads, and misshapen myofibers are indicated with white arrows and outlined.
Confocal microscope fluorescence images of slow skeletal muscle of 3 dpf larvae, stained with phalloidin‐rhodamine. Puncta of filamentous actin are indicated with white arrowheads, distorted myofibers are indicated with arrows and outlined, and frayed myofibers are indicated with yellow arrowhead.
Confocal fluorescence images of slow skeletal muscle of 1 dpf larvae, stained with phalloidin‐rhodamine (red), anti‐α‐actinin antibodies (green), and DAPI (blue).
Confocal fluorescence images of slow skeletal muscle of 3 dpf larvae, stained with phalloidin‐rhodamine (red), anti‐α‐actinin antibodies (green), and DAPI (blue). Bundle of actin ringed with α‐actinin indicated with white‐bordered black arrowhead.
Myoseptal intervals of slow skeletal muscle at 1 dpf in smyhc1+/+ (n = 54), smyhc1−/− (n = 31), smyhc1R673H/+ (n = 45), and smyhc1R673H/R673H (n = 49). Distance between myosepta was measured perpendicular to rostral‐caudal body axis at defined mid‐body regions in phalloidin stained slow skeletal muscle fluorescence images. The central bands of the boxplots represent the median, the boxes of the boxplots represent the interquartile range (between the first and third quartile), and the whiskers represent the minimum and maximum values, up to 1.5 times the interquartile range. Outliers displayed are outside of this range.
Myoseptal intervals of slow skeletal muscle at 3 dpf in smyhc1+/+ (n = 51), smyhc1−/− (n = 32), smyhc1R673H/+ (n = 64), and smyhc1R673H/R673H (n = 38). The central bands of the boxplots represent the median, the boxes of the boxplots represent the interquartile range (between the first and third quartile), and the whiskers represent the minimum and maximum values, up to 1.5 times the interquartile range. Outliers displayed are outside of this range.
Z‐disk intervals (sarcomere length) of slow skeletal muscle at 1 dpf in smyhc1+/+ (n = 380), smyhc1R673H/+ (n = 293), and smyhc1R673H/R673H (n = 268). Distance between z‐disks was measured in anti‐α‐actinin stained slow skeletal muscle fluorescence images. The central bands of the boxplots represent the median, the boxes of the boxplots represent the interquartile range (between the first and third quartile), and the whiskers represent the minimum and maximum values, up to 1.5 times the interquartile range. Outliers displayed are outside of this range.
Z‐disk intervals (sarcomere length) of slow skeletal muscle at 3 dpf in smyhc1+/+ (n = 249), smyhc1−/− (n = 278), smyhc1R673H/+ (n = 246), and smyhc1R673H/R673H (n = 252). The central bands of the boxplots represent the median, the boxes of the boxplots represent the interquartile range (between the first and third quartile), and the whiskers represent the minimum and maximum values, up to 1.5 times the interquartile range. Outliers displayed are outside of this range.
Data Information: Wilcoxon rank‐sum test used to calculate significance. P‐values comparing each group displayed above data. Scale bars represent a length of 50 μm.
This image is the copyrighted work of the attributed author or publisher, and
ZFIN has permission only to display this image to its users.
Additional permissions should be obtained from the applicable author or publisher of the image.
Full text @ EMBO Mol. Med.
Your Input Welcome
Thank you for submitting comments. Your input has been emailed to ZFIN curators who may contact you if
additional information is required.
Oops. Something went wrong. Please try again later.