FIGURE SUMMARY
Title

The identification of dual protective agents against cisplatin-induced oto-and nephrotoxicity using the zebrafish model

Authors
Wertman, J.N., Melong, N., Stoyek, M.R., Piccolo, O., Langley, S., Orr, B., Steele, S.L., Razaghi, B., Berman, J.N.
Source
Full text @ Elife

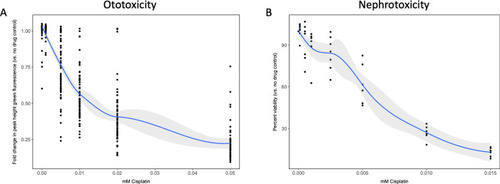
(A) Groups of approximately 50 casper zebrafish larvae were treated with increasing doses of cisplatin, by addition to the E3 media surrounding the larvae, at 72 hr post-fertilization (hpf). The following day, larval neuromasts were stained with 2 µM YO-PRO1, then were subjected to Biosorter-mediated fluorescence profiling. Peak Height (PH) of green fluorescence is displayed, relative to untreated controls. Each data point represents an individual larva. Dose–response relationship is represented by the blue line, which was calculated with a four-parameter log-logistic model, as described in a relevant study (Ritz et al., 2015). Modeling was done in R with a drc extension package. Grey-shaded area represents the 95% confidence interval (CI) of this line. (B) HK-2 human proximal tubule cells were treated with increasing concentrations of cisplatin for 48 hr. Cells were rinsed, then an alamarBlue assay was performed as per the manufacturer’s instructions. Data are represented as % viability, in comparison with untreated cells. N = 4, an average of at least two wells was measured per replicate. Dose–response analysis performed as in A).

Dose–response curves demonstrate decreasing neuromast integrity and human proximal tubule cell viability with increasing doses of cisplatin.

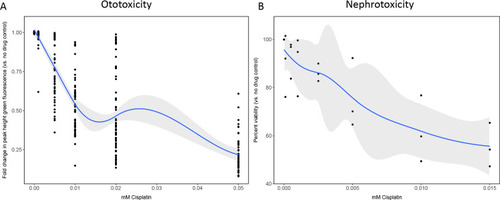
(A) Groups of 50 casper zebrafish larvae were treated with increasing doses of cisplatin, by addition to the E3 media, at 72 hr post-fertilization (hpf). Two days later, larvae were stained with 2 µM YO-PRO1, then were subjected to Biosorter-mediated fluorescence profiling. Peak Height (PH) of green fluorescence is displayed, relative to untreated controls. Each data point represents an individual larva. Dose–response relationship is represented by the blue line, calculated with a four-parameter log-logistic model, as described in a relevant study (Ritz et al., 2015). Modeling was done in R with a drc extension package. Grey-shaded area represents the 95% confidence interval (CI) of this line. (B) HK-2 human proximal tubule cells were treated with increasing concentrations of cisplatin for 24 hrs. Cells were rinsed, then an alamarBlue assay was performed as per the manufacturer’s instructions. Data are represented as % viability, in comparison with untreated cells. N=3, an average of at least two wells was measured per replicate. Dose response analysis performed as in A).

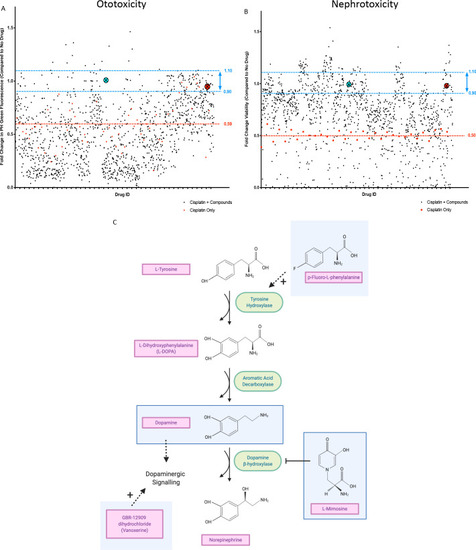
In vivo ototoxicity and in vitro nephrotoxicity drug screens reveal 22 compounds that are potentially oto- and nephroprotective, including dopamine and L-mimosine.

(A) Zebrafish larvae were pretreated with either vehicle control, or each of the compounds from the Sigma LOPAC1280 library of pharmacologically active compounds at a final concentration of 0.01 mM. Three hours later, at 72 hr post-fertilization (hpf), larvae were treated with either vehicle control or cisplatin, at a concentration of 0.02 mM. 48 hr later, larval neuromasts were stained with YO-PRO1 and subjected to fluorescence profiling using a Biosorter. Peak Height (PH) green fluorescence is displayed, in comparison with untreated larvae. Each compound was tested on four larvae and the average is displayed. The aqua point in the X represents dopamine hydrochloride and the red point with the X represents L-mimosine. The blue lines correspond to 0.9–1.1 fold of the control value and the red line corresponds to the average of fish treated with cisplatin alone. (B) HK-2 kidney proximal tubule cells were either treated with vehicle control, 0.005 mM cisplatin alone, or 0.005 mM cisplatin + each of the compounds from the Sigma LOPAC1280 drug library at a final concentration of 0.01 mM. Two days later, an alamar Blue assay was performed according to the manufacturer’s instructions to determine cell viability. Fold change in viability (in comparison with vehicle control treated cells) is displayed. The average of two wells was used per drug. Highlighted points and lines correspond to those in A). (C) The dopamine biosynthesis pathway consists of intermediate molecules and enzymes (indicated with green ovals). The compounds that were hits in both assays are shown in light blue boxes. L-mimosine is able to inhibit dopamine beta-hydroxylase. P-fluoro-L-phenylalanine can act as a substrate for tyrosine hydroxylase. GBR-12909 dihydrochloride (aka. Vanoxerine) is a selective dopamine reuptake inhibitor. All these compounds could have the net pharmacological effect of increasing available dopamine levels.

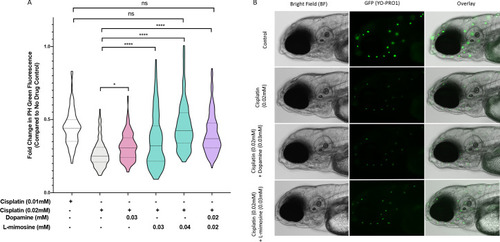
Dopamine and L-mimosine pretreatment partially protects zebrafish larval neuromasts from cisplatin-induced damage.

(A) Following dose and scheduling optimization, groups of larvae at 60 hr post-fertilization (hpf) were treated with either vehicle control or the indicated concentrations of protective agents. Larvae were rinsed then treated with either vehicle control or cisplatin at the indicated concentration at 72 hpf. The following day, the larval neuromasts were stained with 2 µM YO-PRO1 then subjected to fluorescence profiling using a Biosorter. Fold change in Peak Height (PH) fluorescence is displayed, compared to untreated controls.*=p<0.05, ****=p<0.001, as per Kruskal-Wallis with a Dunn’s multiple comparison test between indicated groups. Violin plot displays the median in a solid line and the interquartile range with hashed lines, with surrounding data points outlined by the shape. N=3, average of 75 larvae/treatment/replicate. (B) Representative images of larvae measured in A), with the treatment types as shown, viewed with brightfield (BF) or fluorescence (green neuromasts, YO-PRO1), or overlay of BF and fluorescence. Images acquired with an Axio Observer Z1 microscope at 20X.

Dopamine and L-mimosine pretreatment protects zebrafish inner ear hair cells from cisplatin-induced damage.

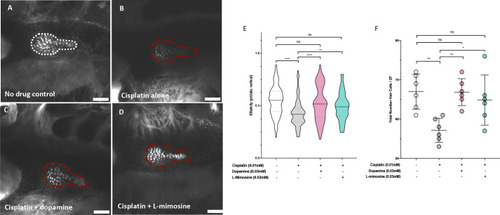
Casper zebrafish larvae were first pretreated at 60 hr post-fertilization (hpf) with either vehicle control (A and B), 0.03 mM dopamine (C), or 0.03 mM L-mimosine (D). Larvae were then rinsed at 72 hpf and treated with either vehicle control (A) or 0.01 mM cisplatin B-D). Two days later (48 hr cisplatin treatment), larvae were fixed, permeabilized, then stained with AlexaFluor488-Phalloidin, then imaged with a Zeiss LSM510 confocal microscope. Larvae mounted laterally with ventral side at the top. Scale bar = 20 µM. N=6/treatment. White line dashed represents the average posterior macula placode of three control larvae, red dashed line represents this average area superimposed onto other treatments. Note that these images were taken with the exact same settings to ensure accurate representation. (E) To perform topological analysis of the hair cells, the original Zeiss LSM files of 2D images ranging from 27 to 42 μm in depth were imported to Imaris v.X64 9.1.2 software for surface reconstruction. Ellipticity (prolate, or elongation around the long axis) was used as a measure of the status of the hair cells with healthier hair cells exhibiting a higher prolate ellipticity. **=p<0.01, ****=p<0.001, as per Kruskal-Wallis testing with a Dunn’s multiple comparison test. (F) Hair cell numbers were counted using the Cell Counter plugin in ImageJ using the same maximum projection images used in E). Individual points represent the number of hair cells/larvae. *=p<0.05, **=p<0.01, and ****=p<0.001, as per one-way ANOVA with a Tukey post-test. N = 6 larvae/treatment with 16 hair cells measured/larvae.

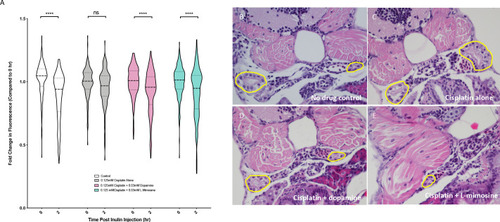
(A) Casper zebrafish larvae were treated at 60 hr post-fertilization (hpf) with either vehicle control or the indicated protective agents. At 72 hpf, larvae were rinsed then treated with either vehicle control or 0.125 mM cisplatin for 24 hr. Larvae were then injected via the common cardinal vein with FITC-inulin, then measured for fluorescence swiftly with the Biosorter. Larvae were rinsed then measured 2 hr later. Fold change in overall larval fluorescence is represented in relation to 0 hr. ****=p<0.001, as per two-way ANOVA with a Tukey post-test. Three replicates, with 50 larvae/treatment group/time point minimum. Representative images of larvae can be found in Figure 5—figure supplement 1d. Larvae were treated as in (A) and were fixed at either 24 hr post-treatment (B–E) or at 72hpt (Figure 5—figure supplement 2a-d). Larvae were pre-embedded in low melting point agarose, then in paraffin, then sectioned and stained with H and E. (B) Control, (C) Cisplatin only, (D) Cisplatin + 0.03 mM dopamine, (E) Cisplatin + 0.03 mM L-mimosine. No significant differences were observed in the proximal tubular histology.

Optimization of the experimental detection of cisplatin-induced decreases in glomerular filtration rate (GFR) in zebrafish larvae.

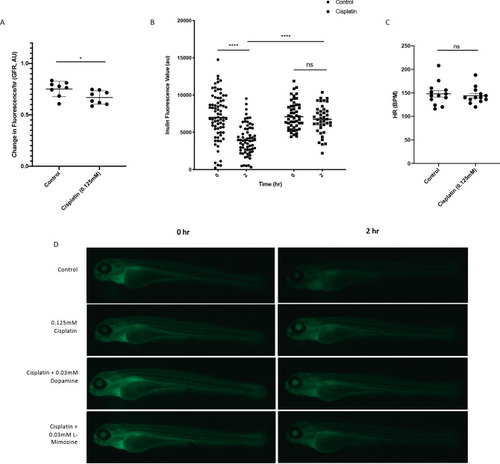
Casper zebrafish larvae were treated at 72 hr post-fertilization (hpf) with either vehicle control or 0.125 mM cisplatin for 24 hr. Larvae were rinsed, then injected via the common cardinal vein with FITC-inulin. (A) Inulin-injected larvae were imaged immediately after injection and 2 hr after injection. Larval fluorescence was measured using ImageJ software using a region of interest (ROI) superimposed on the tail of each larvae. The change in fluorescence between the two time points (a relative measure of GFR) was calculated, and is displayed in arbitrary units (AU). Each data point represents the change in fluorescence of an individual larvae. Error bars represent SEM. *=p<0.05, as per two-tailed student’s t-test. N=2, at least four larvae/treatment group/experiment. (B) Larvae were treated as in A), but were measured for overall larval fluorescence immediately after injection and 2 hr after injection using a Biosorter. Results display raw larval fluorescence values. Each data point represents an individual larvae at each time point. ****=p<0.001, as per two-way ANOVA with a tukey post-test. N=1, with at least 50 larvae/treatment group. (C) Heart rate (HR) was measured in larvae treated as in A), to determine if changes in HR had an effect on the measured GFR. There was no significant difference between HR regardless of treatment, as per two-tailed student’s t-test. Each data point represents an individual larvae. N=2, with at least six larvae/treatment group. (D) Representative larvae from the experiment described in the main text, and found in Figure 5a. Briefly, casper zebrafish larvae were treated at 60 hpf with either vehicle control or the indicated protective agents. At 72 hpf, larvae were rinsed then treated with either vehicle control or 0.125 mM cisplatin for 24 hr. Larvae were then injected via the common cardinal vein with FITC-inulin, then were imaged using a Zeiss SteREO Discovery.V20 dissecting microscope.

Zebrafish pronephros histology does not look significantly different following treatment with cisplatin or either protective agent at 3 days post-treatment (dpt).

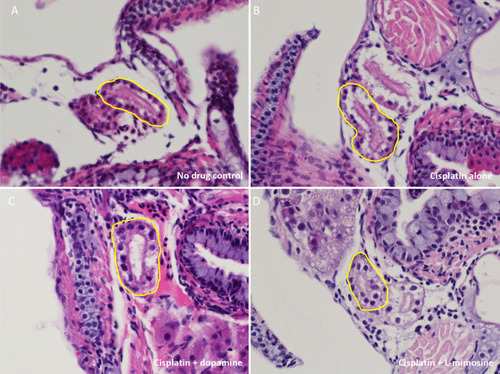
Casper zebrafish larvae were treated at 60 hours post-fertilization (hpf) with vehicle control or either 0.03 mM dopamine or 0.03 mM L-mimosine. Larvae were rinsed 12 hr later, then treated with either vehicle control or 0.125 mM cisplatin. Three days later, larvae were rinsed, sacrificed, then fixed overnight in 4% paraformaldehyde (PFA). The fixed larvae were then pre-mounted in 1.5% low-melting point agarose, then paraffin embedded, sectioned, and stained with H and E. Representative images are shown. (A) Untreated control, (B) Cisplatin alone, (C) 0.03 mM dopamine + cisplatin, (D) 0.03 mM L-mimosine + cisplatin. Yellow outlines highlight proximal tubular structures. Examination by a pathologist suggested that there were no obvious differences between treatment groups.

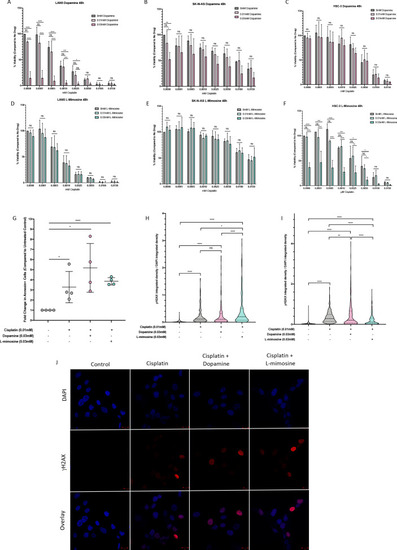
NBL and oral squamous cell carcinoma cell lines were pretreated for 12 hr with vehicle control, or either dopamine or L-mimosine at either 0.01 mM or 0.03 mM. Cells were then treated with increasing concentrations of cisplatin and incubated for either 24 hr (Figure 6—figure supplement 1a-f) or 48 hr (data shown here). (A–F) An alamarBlue assay was used to determine cell viability. Results are displayed as % compared to untreated control. (A and D) LAN5, (B and E) SK-N-AS, (C and F) HSC-3. *=p<0.05, **=p<0.01, ***=p<0.005, and ****=p<0.001, as per two-way ANOVA with a Tukey post-test. N=3. (G) SK-N-AS cells were treated the same as in A-F, with the concentrations of protective agent specified. 48 hr following cisplatin treatment, cells were prepared for PE-conjugated Annexin V/SYTOXBlue-based flow cytometry. Graph of fold change in Annexin+ cells (gated to biological control) is displayed, relative to vehicle control. *=p<0.05, ****=p<0.001, as per two-tailed student’s t-tests comparing treatment groups to control. N=4. Representative flow plots and gating strategies can be found in Figure 6—figure supplement 2a-i H–J) Cancer cells were treated as in A-G, with the concentrations of protective agents specified. Twenty four hours following cisplatin treatment, cells were fixed, permeabilized and labeled with anti-phospho-histone H2A.X (Ser139) and DAPI to label γH2AX positive foci and nuclear material, respectively. (H and I) Quantification of γH2AX staining, reported as γH2AX integrated density/DAPI integrated density, with each data point corresponding to an individual nucleus. *=p<0.05, **=p<0.01, ****=p<0.001, as per Kruskal-Wallis testing with a Dunn’s multiple comparison test. N=3. (H) SK-N-AS cells, (I) LAN5 cells. (J) Representative confocal microscopy of SK-N-AS cells with indicated treatments, displaying DAPI, gamma H2AX, and an overlay.

Dopamine and L-mimosine do not protect cancer cell lines from cisplatin-induced death 24 hr following cisplatin treatment.

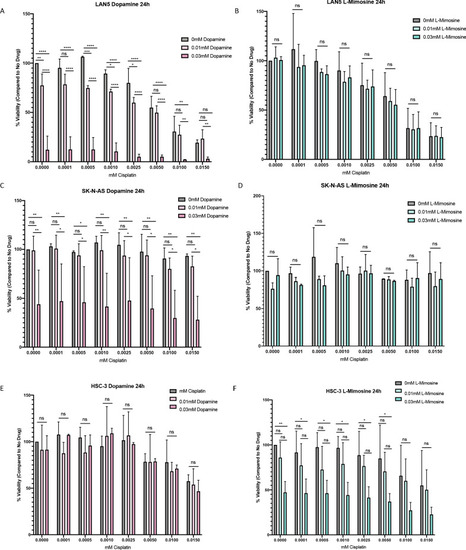
Neuroblastoma (NBL) and oral squamous cell carcinoma cell lines were pretreated for 12 hr vehicle control, or either dopamine or L-mimosine at either 0.01 mM or 0.03 mM. Cells were then treated with increasing concentrations of cisplatin and incubated for 24 hr (48 hr data shown in Figure 6a-f). An alamarBlue assay was used to determine cell viability. Results are displayed as % compared to untreated control. (A and D) LAN5, (B and E) SK-N-AS, (C and F) HSC-3. *=p<0.05, **=p<0.01, ***=p<0.005, and ****=p<0.001, as per two-way ANOVA with a Tukey post-test. N=3.

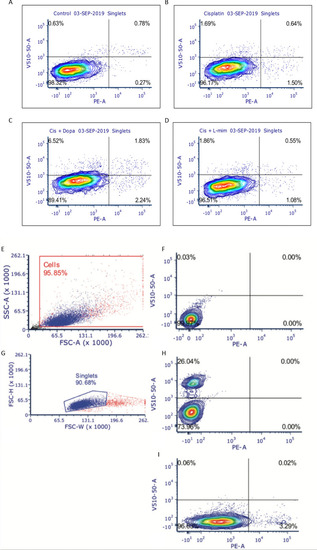
Representative flow plots and gating strategies for the detection of late-stage apoptosis and cell death in SK-N-AS neuroblastoma (NBL) cells.

SK-N-AS neuroblastoma (NBL) cells were treated with either vehicle control or either 0.03 mM dopamine or 0.03 mM L-mimosine for 12 hr, were rinsed, then treated with 0.01 mM cisplatin for 48 hrs. Cells were collected, rinsed, and prepared for PE-conjugated Annexin-V/SYTOXBlue flow cytometry. Data were analyzed using BD FACSDiva Software. (A–D) Representative flow plots demonstrating the four quadrants. LL=Annexin-/SYTOX-, LR=Annexin+/SYTOX-, UL=Annexin-/SYTOX+, UR=Annexin+/SYTOX+. (A) Control untreated cells, (B) Cisplatin only, (C) dopamine + cisplatin, (D) L-mimosine + cisplatin. N=4. (E) General gating strategy to identify living and dead cells in sample and to eliminate cell debris. (F) Unstained control cells. (G) Doublet discrimination strategy. (H) Unstained control cells. (I) Gating strategy to identify SYTOX+ dead cells. Representative plots from heat-killed SYTOX+ control cells. (J) Gating strategy to identify Annexin+ cells. Representative flow plot from cells treated with Camptothecin to induce apoptosis.

Acknowledgments
This image is the copyrighted work of the attributed author or publisher, and ZFIN has permission only to display this image to its users. Additional permissions should be obtained from the applicable author or publisher of the image. Full text @ Elife