
|
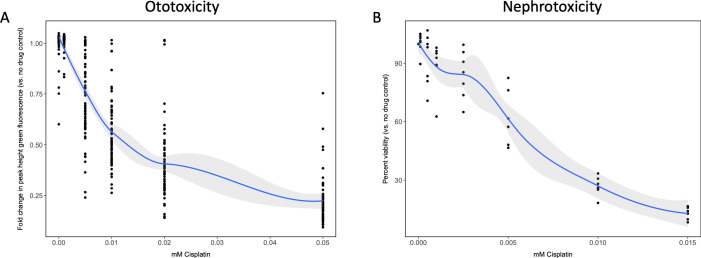
Figure 1 (A) Groups of approximately 50 casper zebrafish larvae were treated with increasing doses of cisplatin, by addition to the E3 media surrounding the larvae, at 72 hr post-fertilization (hpf). The following day, larval neuromasts were stained with 2 µM YO-PRO1, then were subjected to Biosorter-mediated fluorescence profiling. Peak Height (PH) of green fluorescence is displayed, relative to untreated controls. Each data point represents an individual larva. Dose–response relationship is represented by the blue line, which was calculated with a four-parameter log-logistic model, as described in a relevant study (Ritz et al., 2015). Modeling was done in R with a drc extension package. Grey-shaded area represents the 95% confidence interval (CI) of this line. (B) HK-2 human proximal tubule cells were treated with increasing concentrations of cisplatin for 48 hr. Cells were rinsed, then an alamarBlue assay was performed as per the manufacturer’s instructions. Data are represented as % viability, in comparison with untreated cells. N = 4, an average of at least two wells was measured per replicate. Dose–response analysis performed as in A).