
- Title
-
Zebrafish Xenografts Unveil Sensitivity to Olaparib beyond BRCA Status
- Authors
- Varanda, A.B., Martins-Logrado, A., Ferreira, M.G., Fior, R.
- Source
- Full text @ Cancers
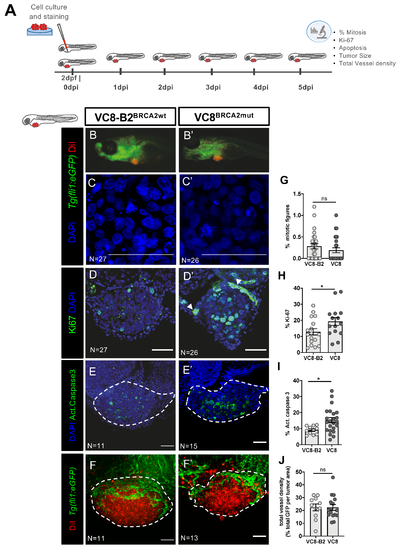
BRCA status can influence cancer-related hallmark phenotypes in a zebrafish xenograft model. VC8-B2BRCA2wt and VC8BRCA2mut hamster cell lines were fluorescently labeled with Vybrant CM-DiI (in red) and injected in the perivitelline space (PVS) of 2 days post fertilization (2dpf) Tg(Fli1:eGFP) zebrafish embryos (A). At 5dpi, zebrafish xenografts were imaged in the stereoscope (B,B’) and by confocal microscopy (C–F’). The percentage of mitotic figures (nuclei in blue) (G), Ki-67 (in green) (H), activated caspase 3 (in green) (I) and total vessel density (J, %GFP area—in green—relative to the whole tumor area) were quantified. All images are anterior to the left, posterior to right, dorsal up, and ventral down (as depicted in the scheme on top left). The dashed lines delineate the tumor area. Scale bar: 50 µm. Results are from three independent experiments and expressed as mean ± SEM, each dot represents one xenograft. The total number of xenografts analyzed is indicated in the images. Statistical results: not significant (ns) > 0.05, * p ≤ 0.05. PHENOTYPE:
|
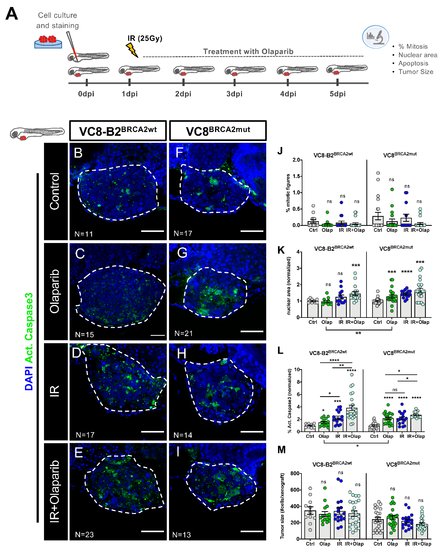
VC8 and VC8-B2 zebrafish xenografts show different sensitivities to treatment with olaparib and IR. VC8-B2BRCA2wt and VC8BRCA2mut cell lines were fluorescently labeled with CM-DiI (not shown) and injected into the perivitelline space (PVS) of 2dpf zebrafish embryos. At 24 h post-injection (24 hpi), zebrafish xenografts were screened and randomly distributed into the different experimental conditions: control, olaparib, IR, IR + olaparib. Xenografts were treated for 4 consecutive days and fixed at 5dpi (A). Zebrafish xenografts were sacrificed and fixed at 5dpi and prepared for confocal microscopy by immunolabeling for activated caspase 3 (marker for cellular death, in green) and nuclei staining with DAPI (in blue) (B–I). Mitotic index (J), nuclear area size (K), cell death-activated caspase 3 (L) and average tumor size (number of human DAPI cells) (M) were analyzed by confocal microscopy and quantified. The % of activated caspase 3 cells was normalized to respective controls to compare between different xenografts in different conditions. All images are anterior to the left, posterior to right, dorsal up, and ventral down (as depicted in the scheme on top left). The dashed line delineates the tumor area. Scale bar: 50 µm. Results are from three independent experiments and expressed as mean ± standard error of the mean (SEM), each dot represents one xenograft. The total number of xenografts analyzed is indicated in the images. Statistical results: ns > 0.05, * p ≤ 0.05, ** p ≤ 0.01, *** p ≤ 0.001, **** p ≤ 0.0001. |
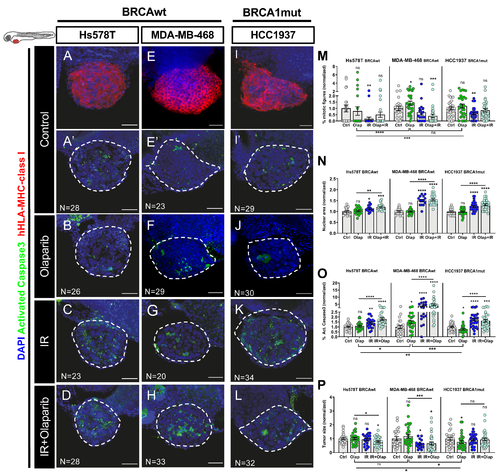
Zebrafish xenografts of triple negative breast cancer (TNBC) reveal different responses to olaparib and ionizing radiation (IR) independently of BRCA status. TNBC cell lines (Hs578TBRCAwt, MDA-MB-469BRCAwt and Hcc1937BRCA1mut) were fluorescently labeled with CM-DiI (not shown) and injected into the perivitelline space (PVS) of 2dpf zebrafish embryos. At 24 hpi, zebrafish xenografts were screened and randomly distributed into the different experimental conditions: control, olaparib, IR, IR + olaparib. Xenografts were treated for 4 consecutive days and fixed at 5dpi. Representative confocal images of xenografts labelled with anti-human-leukocyte antigen-major histocompatibility complex (HLA-MHC)-class I (in red) (A,E,I) and anti-activated caspase 3 (in green) (A’–L). Nuclei were stained with DAPI (in blue) (A–L). Mitotic index (M), nuclear area size (N), cell death-activated caspase3 (O) and average tumor size (number of human DAPI cells) (P) were analyzed by confocal microscopy and quantified. The % of activated caspase 3 cells and tumor size were normalized to respective controls to compare between different xenografts in different conditions. All images are anterior to the left, posterior to right, dorsal up, and ventral down (as depicted in the scheme on top left). The dashed line delineates the tumor area. Scale bar: 50 µm. Results are from three independent experiments and expressed as mean ± SEM, each dot represents one xenograft. The total number of xenografts analyzed is indicated in the images. Statistical results: ns > 0.05, * p ≤ 0.05, ** p ≤ 0.01, *** p ≤ 0.001, **** p ≤ 0.0001. |
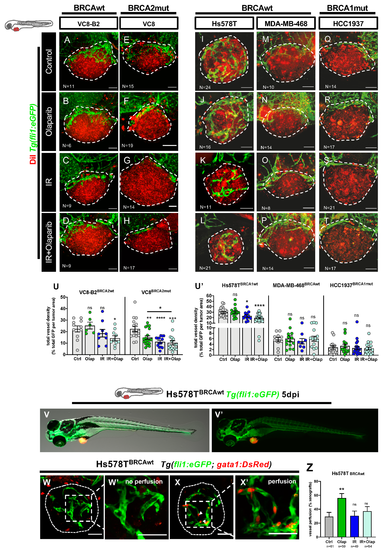
Olaparib and IR can have modulating effects on the tumor vascular network. All cell lines were fluorescently labeled with CM-DiI (in red) and injected in the perivitelline space (PVS) of 2dpf Tg(fli1:eGFP)zebrafish embryos. At 24 hpi, zebrafish xenografts were screened and randomly distributed into the different experimental conditions: control, olaparib, IR, IR + olaparib. Xenografts were treated for 4 consecutive days, fixed at 5dpi and imaged by confocal microscopy for analysis of vessel density (A–T). The quantification of vessel density is represented by percentage of tumor area occupied by vessels (in green) (U). To analyze vessel functionality, TNBC cell line Hs578T was fluorescently labeled with CellTracker™ Deep Red Dye (in red-false color) and injected in the PVS of 2dpf Tg(gata1:RFP;fli1:eGFP). Hs578T xenografts were screened and randomly distributed in the different experimental conditions: control, olaparib, IR and IR + olaparib. Representative images of 5dpi Hs578T xenografts (V,V’). The presence of erythrocytes (in red) inside the tumor-associated vessels (in green) was scored as: absence of erythrocytes = no perfusion (W,W’) or presence of erythrocytes = with perfusion (X,X’) and quantified (Z). All images are anterior to the left, posterior to right, dorsal up, and ventral down (as depicted in the scheme on top left). The dashed lines delineate the tumor area. White arrowheads indicate erythrocytes inside the vasculature. Scale bar: 50 µm. Results are from three independent experiments and expressed as mean ± SEM, each dot represents one xenograft. The total number of xenografts analyzed is indicated in the images. Statistical results: ns > 0.05, * p ≤ 0.05, ** p ≤ 0.01, *** p ≤ 0.001, **** p ≤ 0.0001. |
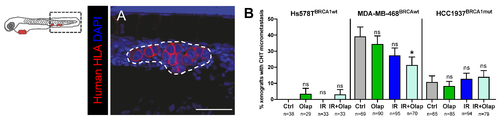
Metastatic potential of TNBC cell lines is modulated by olaparib and IR. TNBC (Hs578TBRCAwt, MDA-MB-469BRCAwt and Hcc1937BRCA1mut) xenografts were generated as previously described and at 24 hpi, were screened and randomly distributed into the different experimental conditions: control, olaparib, IR, IR + olaparib. At 5dpi and 4 days post-treatment, xenografts were fixed to analyze the presence of micrometastasis in the caudal hematopoietic tissue (CHT) (A). Representative image of a micrometastasis in the CHT is labelled with anti-human-HLA–MHC-class (in red) for human cell identification. The dashed white line represents the micrometastasis area, scale bar: 50 µm (A). The metastatic potential was quantified as the percentage of xenografts that present micrometastasis in the CHT at 5dpi (B). Results are from three independent experiments and expressed as mean ± SEM. The total number of xenografts analyzed is indicated below the chart. Statistical results: ns > 0.05, * p ≤ 0.05. |
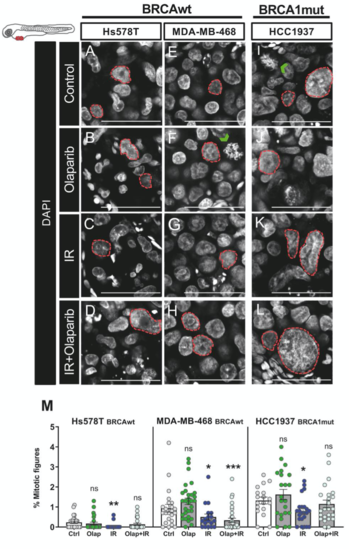
Single-cell resolution nuclear morphology changes upon challenge with Olaparib and/or IR. TNBC cell lines (Hs578TBRCAwt, MDA-MB-469BRCAwt and Hcc1937BRCA1mut) were fluorescently labeled with CM-DiI (not shown) and injected in the perivitelline space (PVS) of 2dpf zebrafish larvae. Zebrafish xenografts were screened and randomly distributed amongst experimental conditions; treatment regimens were started at 24 h post injection (24hpi). Zebrafish xenografts were sacrificed and fixed at 5 days post injection (dpi) and imaged by confocal microscopy with DAPI staining (in grey). (A–L). The green arrowheads illustrate examples of the quantified mitotic figures. The quantification of mitotic figures is represented in percentage in relation to total number of cells. (M). Results are from 3 independent experiments and expressed as mean ± SEM, each dot represents one xenograft. Statistical results: not significant (ns) > 0.05, * p ≤ 0.05, ** p ≤ 0.01, *** p ≤ 0.001. The dashed line represents tumor nuclear area. Scale bar: 50 μm. |