
|
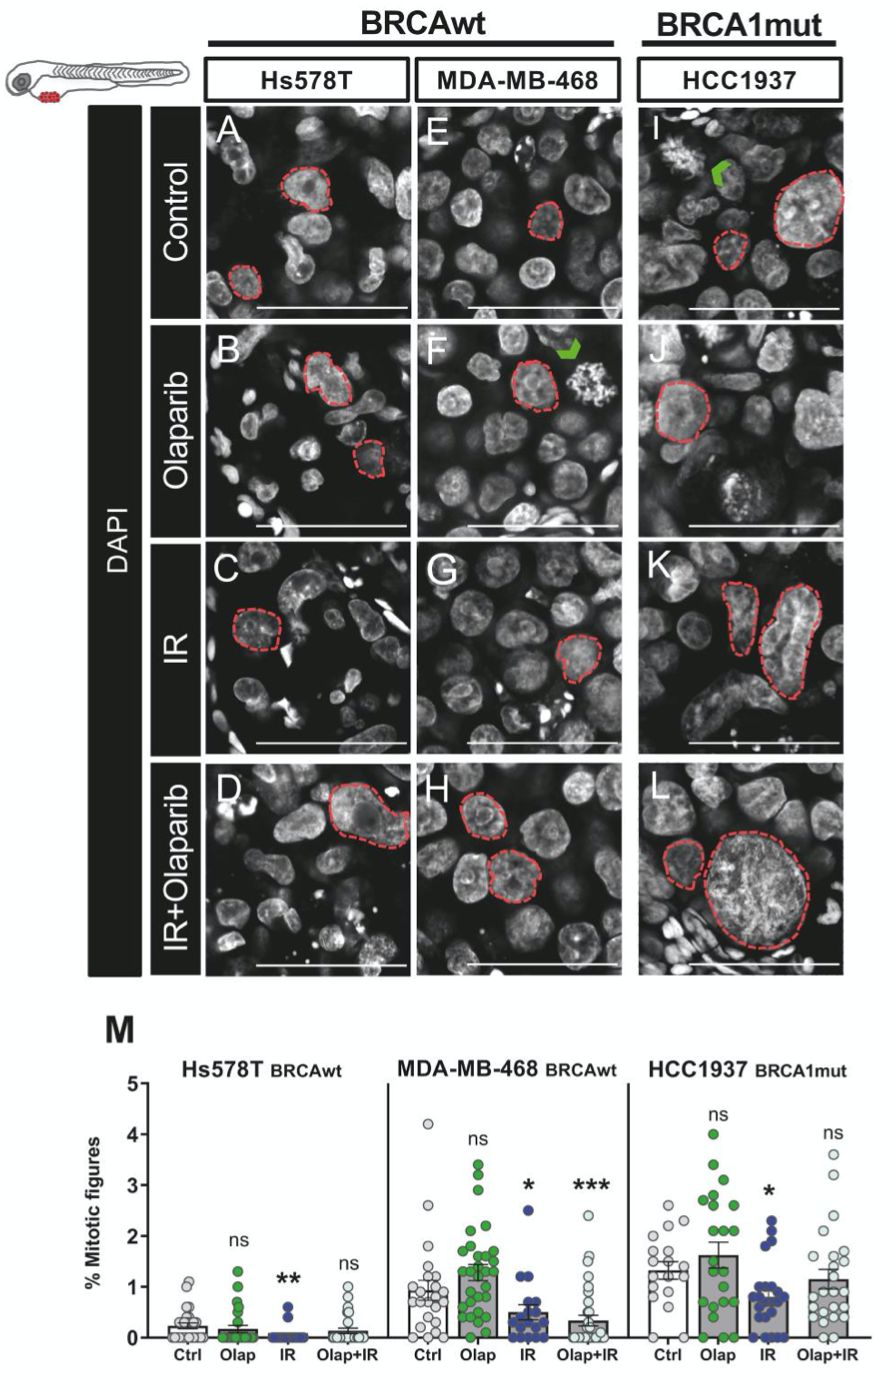
Fig. S3
Single-cell resolution nuclear morphology changes upon challenge with Olaparib and/or IR. TNBC cell lines (Hs578TBRCAwt, MDA-MB-469BRCAwt and Hcc1937BRCA1mut) were fluorescently labeled with CM-DiI (not shown) and injected in the perivitelline space (PVS) of 2dpf zebrafish larvae. Zebrafish xenografts were screened and randomly distributed amongst experimental conditions; treatment regimens were started at 24 h post injection (24hpi). Zebrafish xenografts were sacrificed and fixed at 5 days post injection (dpi) and imaged by confocal microscopy with DAPI staining (in grey). (A–L). The green arrowheads illustrate examples of the quantified mitotic figures. The quantification of mitotic figures is represented in percentage in relation to total number of cells. (M). Results are from 3 independent experiments and expressed as mean ± SEM, each dot represents one xenograft. Statistical results: not significant (ns) > 0.05, * p ≤ 0.05, ** p ≤ 0.01, *** p ≤ 0.001. The dashed line represents tumor nuclear area. Scale bar: 50 μm.