
Fig. 1
- ID
- ZDB-FIG-200713-39
- Publication
- Varanda et al., 2020 - Zebrafish Xenografts Unveil Sensitivity to Olaparib beyond BRCA Status
- Other Figures
- All Figure Page
- Back to All Figure Page
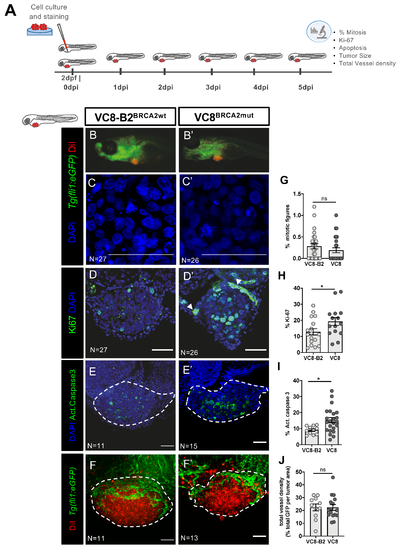
BRCA status can influence cancer-related hallmark phenotypes in a zebrafish xenograft model. VC8-B2BRCA2wt and VC8BRCA2mut hamster cell lines were fluorescently labeled with Vybrant CM-DiI (in red) and injected in the perivitelline space (PVS) of 2 days post fertilization (2dpf) Tg(Fli1:eGFP) zebrafish embryos (A). At 5dpi, zebrafish xenografts were imaged in the stereoscope (B,B’) and by confocal microscopy (C–F’). The percentage of mitotic figures (nuclei in blue) (G), Ki-67 (in green) (H), activated caspase 3 (in green) (I) and total vessel density (J, %GFP area—in green—relative to the whole tumor area) were quantified. All images are anterior to the left, posterior to right, dorsal up, and ventral down (as depicted in the scheme on top left). The dashed lines delineate the tumor area. Scale bar: 50 µm. Results are from three independent experiments and expressed as mean ± SEM, each dot represents one xenograft. The total number of xenografts analyzed is indicated in the images. Statistical results: not significant (ns) > 0.05, * p ≤ 0.05. |
| Fish: | |
|---|---|
| Condition: | |
| Observed In: | |
| Stage: | Days 7-13 |