
|
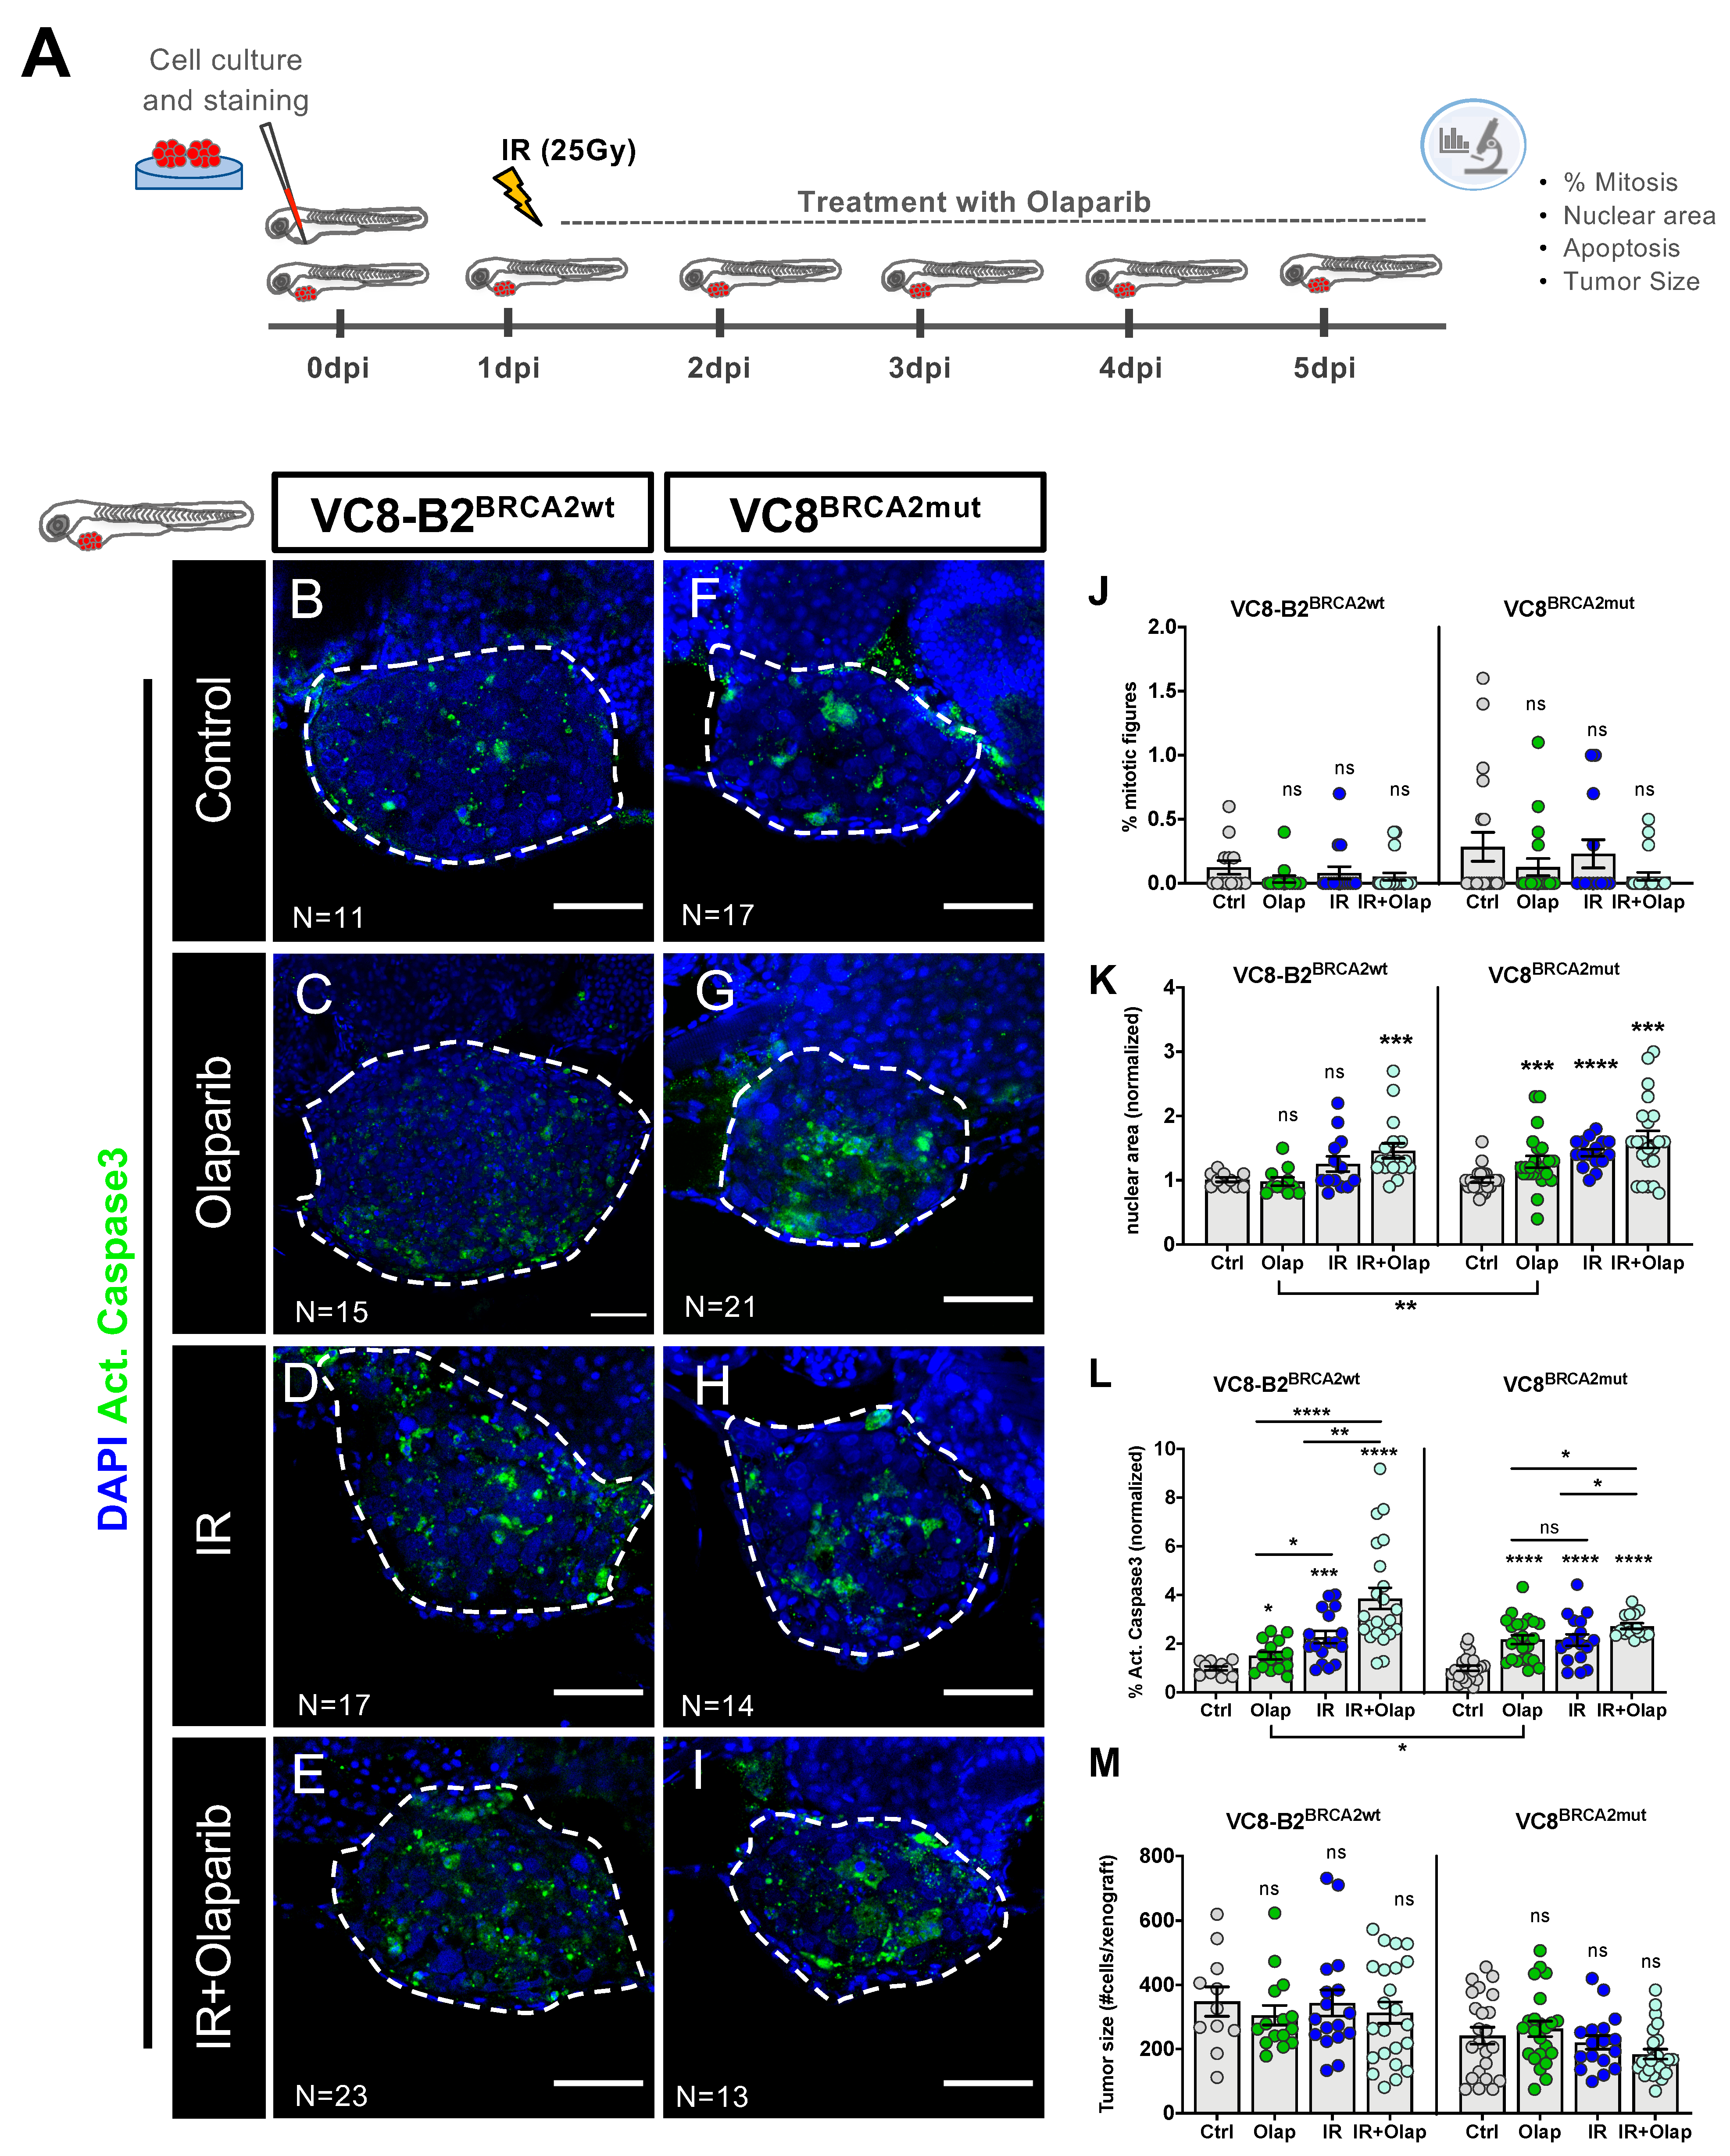
Fig. 2
VC8 and VC8-B2 zebrafish xenografts show different sensitivities to treatment with olaparib and IR. VC8-B2BRCA2wt and VC8BRCA2mut cell lines were fluorescently labeled with CM-DiI (not shown) and injected into the perivitelline space (PVS) of 2dpf zebrafish embryos. At 24 h post-injection (24 hpi), zebrafish xenografts were screened and randomly distributed into the different experimental conditions: control, olaparib, IR, IR + olaparib. Xenografts were treated for 4 consecutive days and fixed at 5dpi (A). Zebrafish xenografts were sacrificed and fixed at 5dpi and prepared for confocal microscopy by immunolabeling for activated caspase 3 (marker for cellular death, in green) and nuclei staining with DAPI (in blue) (B–I). Mitotic index (J), nuclear area size (K), cell death-activated caspase 3 (L) and average tumor size (number of human DAPI cells) (M) were analyzed by confocal microscopy and quantified. The % of activated caspase 3 cells was normalized to respective controls to compare between different xenografts in different conditions. All images are anterior to the left, posterior to right, dorsal up, and ventral down (as depicted in the scheme on top left). The dashed line delineates the tumor area. Scale bar: 50 µm. Results are from three independent experiments and expressed as mean ± standard error of the mean (SEM), each dot represents one xenograft. The total number of xenografts analyzed is indicated in the images. Statistical results: ns > 0.05, * p ≤ 0.05, ** p ≤ 0.01, *** p ≤ 0.001, **** p ≤ 0.0001.