
|
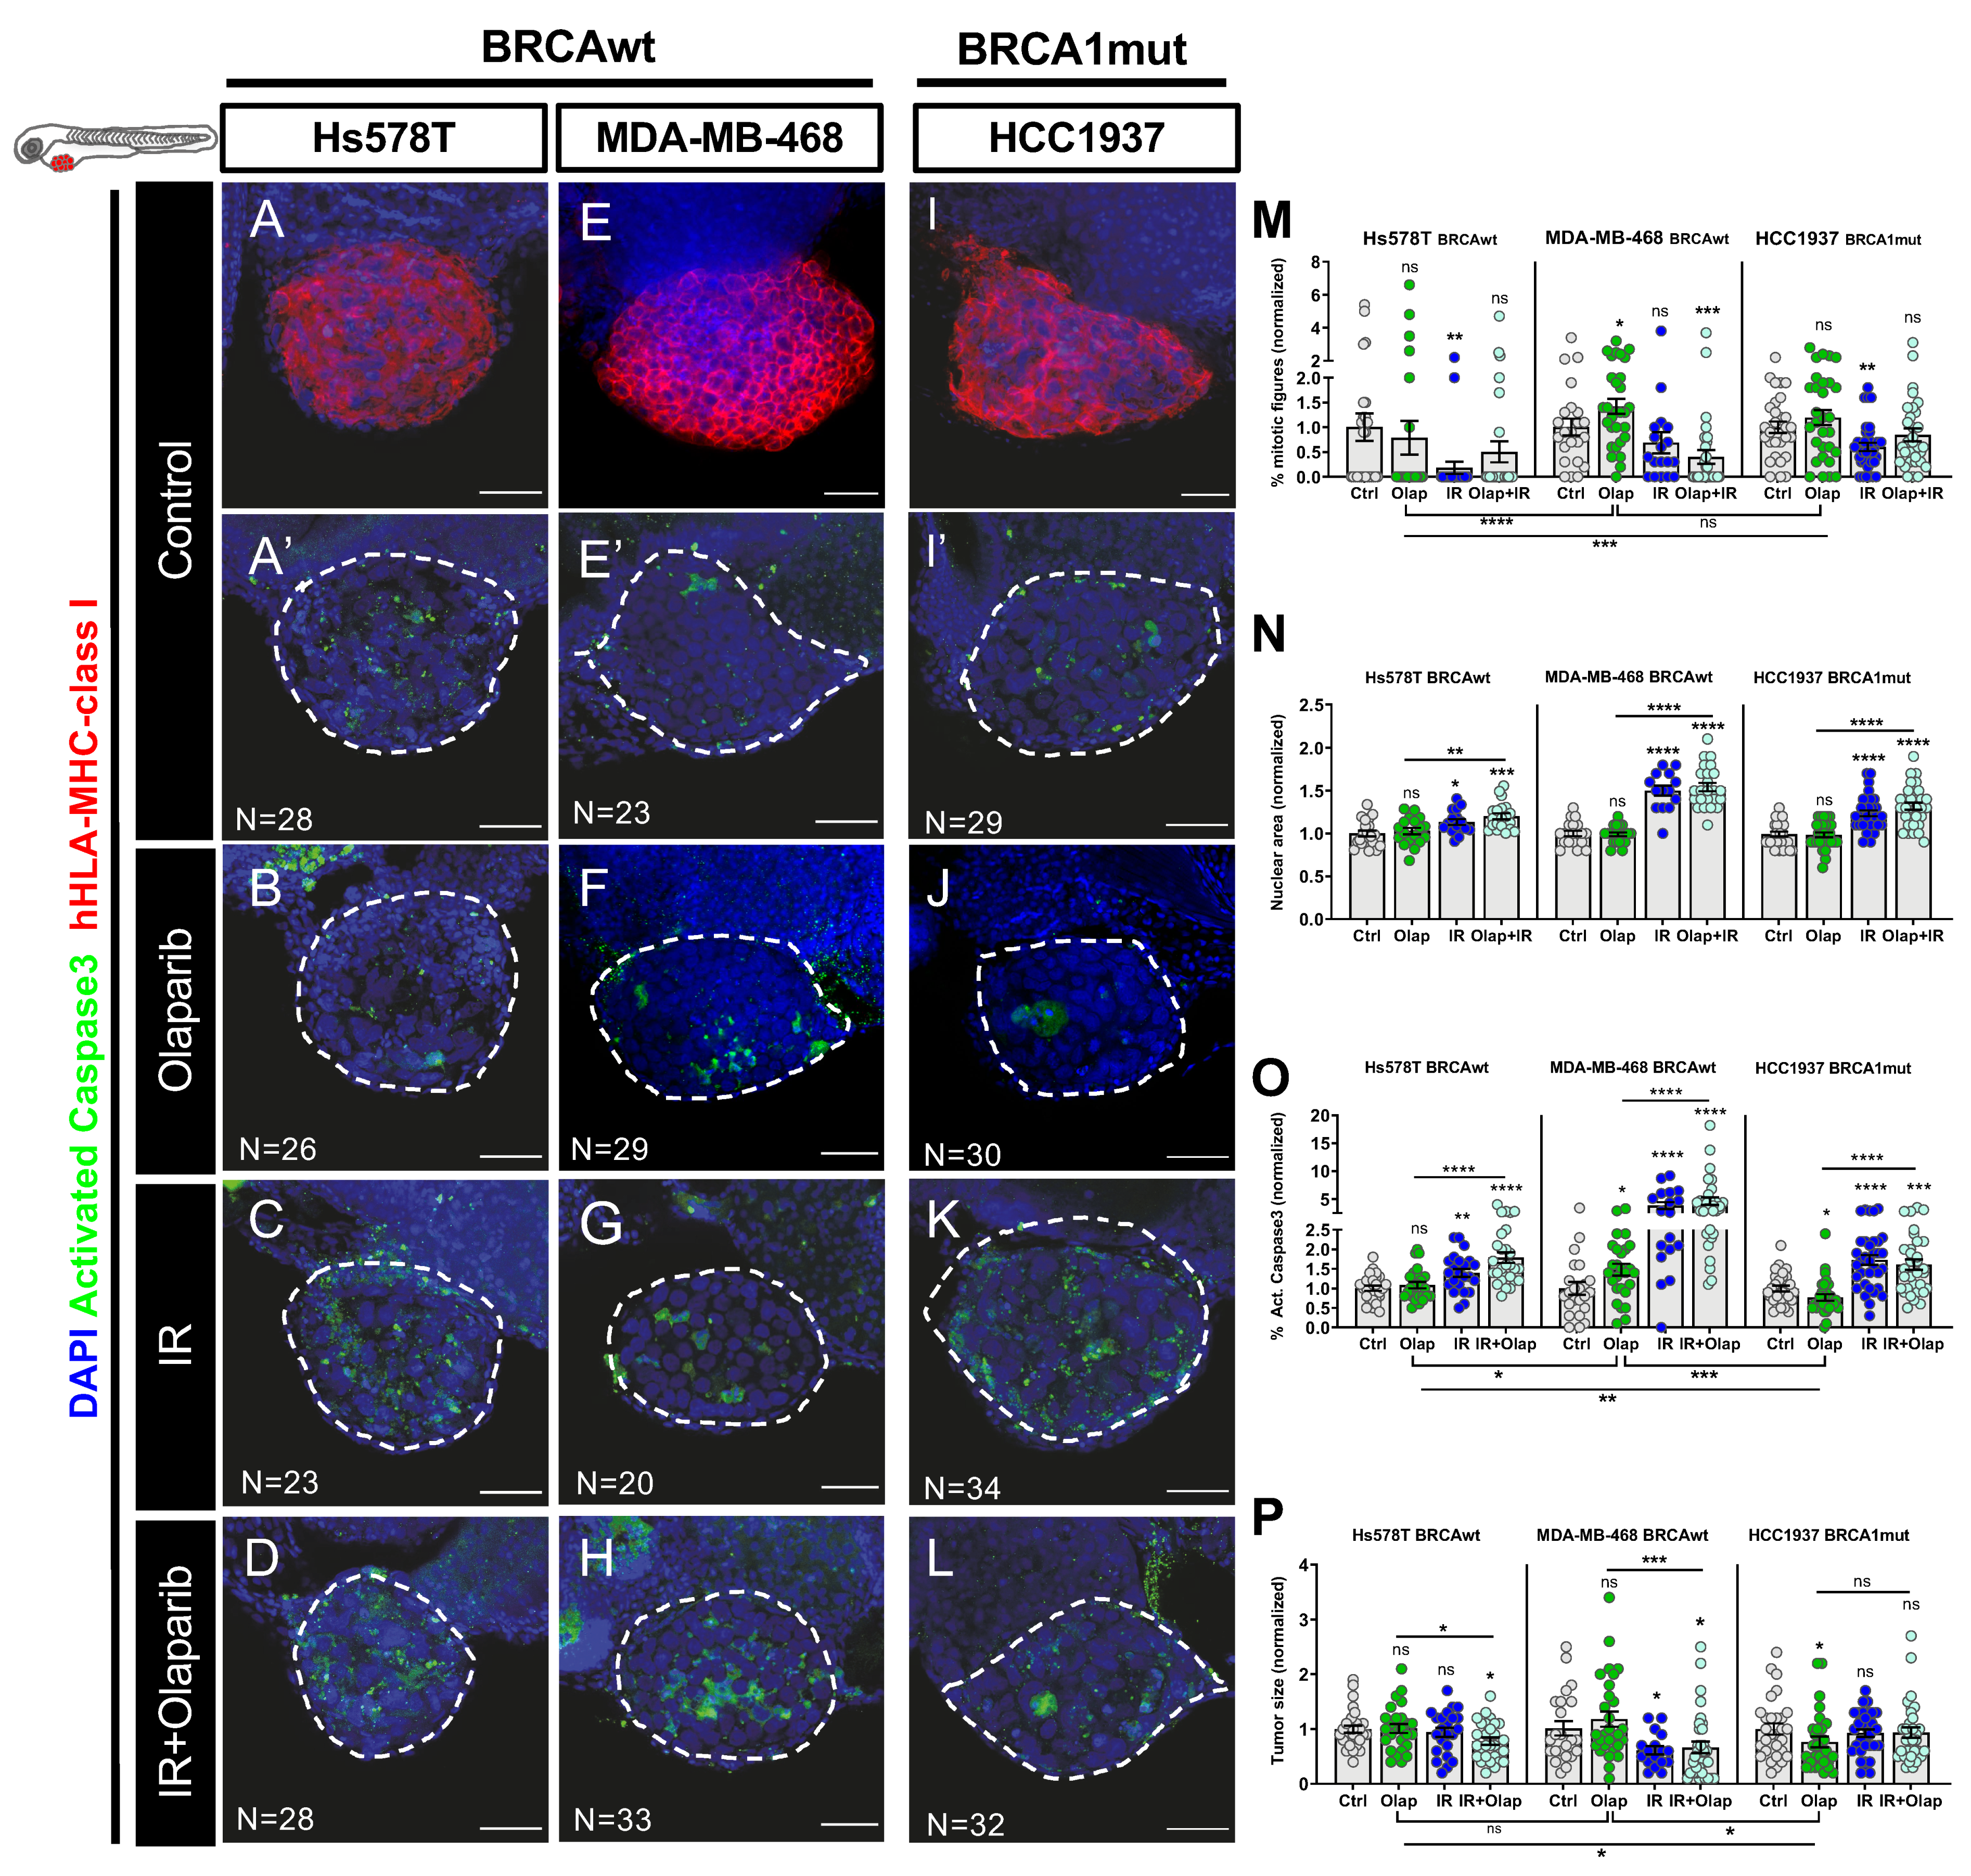
Fig. 3
Zebrafish xenografts of triple negative breast cancer (TNBC) reveal different responses to olaparib and ionizing radiation (IR) independently of BRCA status. TNBC cell lines (Hs578TBRCAwt, MDA-MB-469BRCAwt and Hcc1937BRCA1mut) were fluorescently labeled with CM-DiI (not shown) and injected into the perivitelline space (PVS) of 2dpf zebrafish embryos. At 24 hpi, zebrafish xenografts were screened and randomly distributed into the different experimental conditions: control, olaparib, IR, IR + olaparib. Xenografts were treated for 4 consecutive days and fixed at 5dpi. Representative confocal images of xenografts labelled with anti-human-leukocyte antigen-major histocompatibility complex (HLA-MHC)-class I (in red) (A,E,I) and anti-activated caspase 3 (in green) (A’–L). Nuclei were stained with DAPI (in blue) (A–L). Mitotic index (M), nuclear area size (N), cell death-activated caspase3 (O) and average tumor size (number of human DAPI cells) (P) were analyzed by confocal microscopy and quantified. The % of activated caspase 3 cells and tumor size were normalized to respective controls to compare between different xenografts in different conditions. All images are anterior to the left, posterior to right, dorsal up, and ventral down (as depicted in the scheme on top left). The dashed line delineates the tumor area. Scale bar: 50 µm. Results are from three independent experiments and expressed as mean ± SEM, each dot represents one xenograft. The total number of xenografts analyzed is indicated in the images. Statistical results: ns > 0.05, * p ≤ 0.05, ** p ≤ 0.01, *** p ≤ 0.001, **** p ≤ 0.0001.