
|
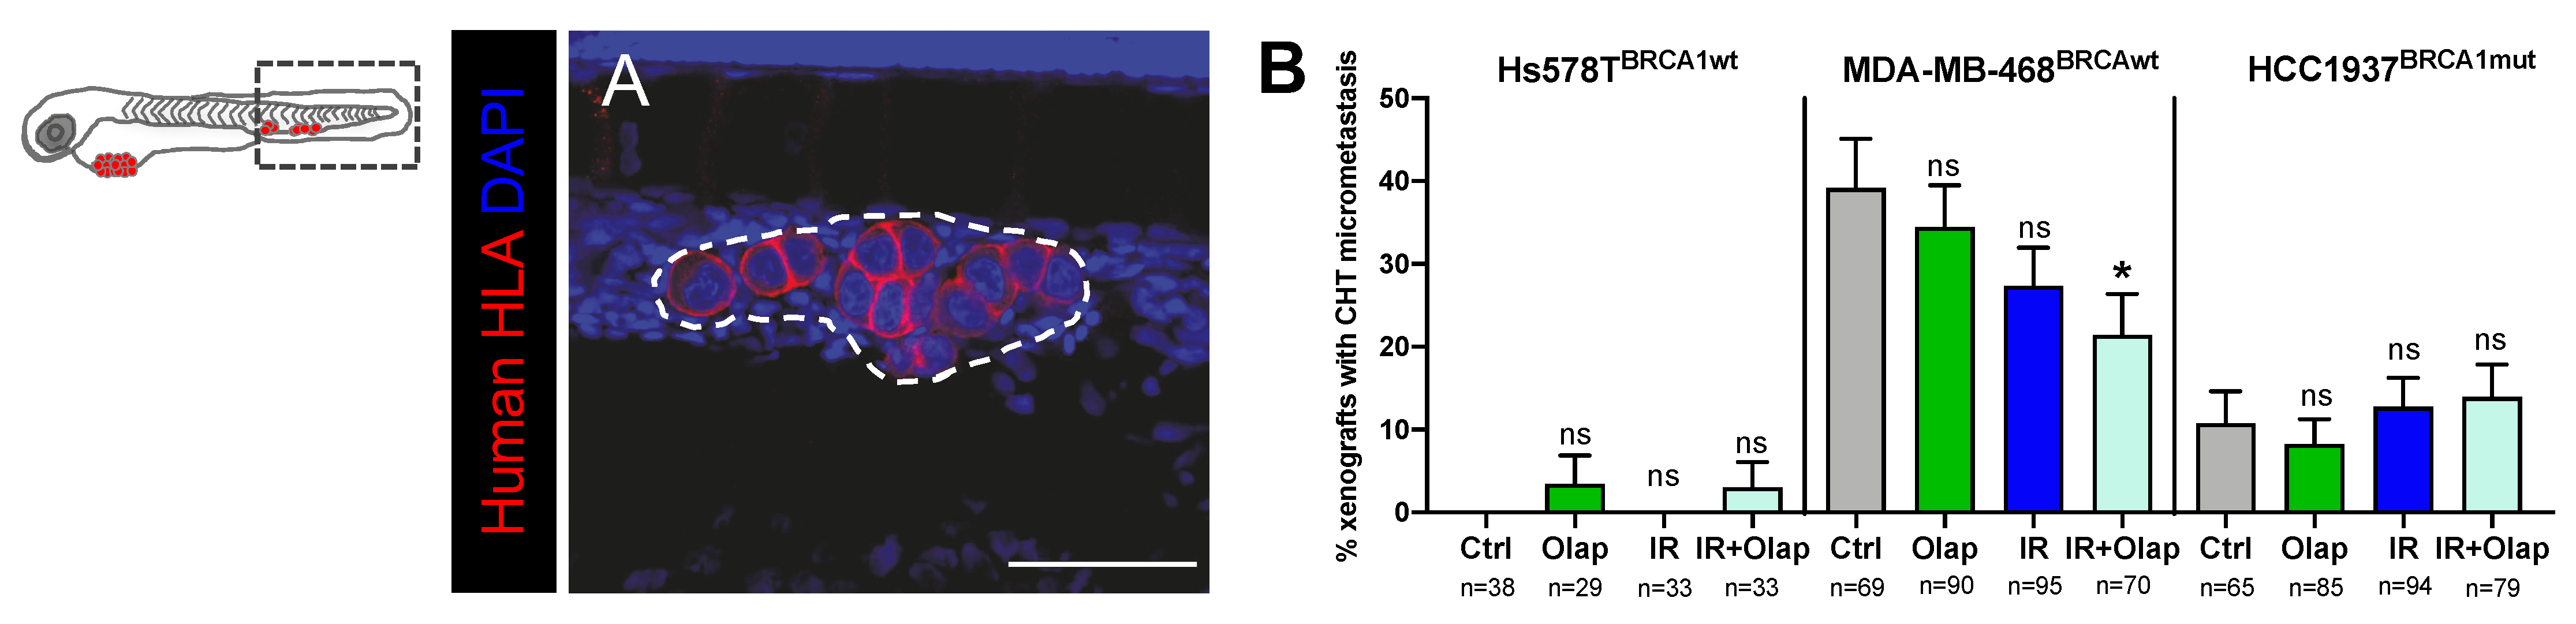
Fig. 5
Metastatic potential of TNBC cell lines is modulated by olaparib and IR. TNBC (Hs578TBRCAwt, MDA-MB-469BRCAwt and Hcc1937BRCA1mut) xenografts were generated as previously described and at 24 hpi, were screened and randomly distributed into the different experimental conditions: control, olaparib, IR, IR + olaparib. At 5dpi and 4 days post-treatment, xenografts were fixed to analyze the presence of micrometastasis in the caudal hematopoietic tissue (CHT) (A). Representative image of a micrometastasis in the CHT is labelled with anti-human-HLA–MHC-class (in red) for human cell identification. The dashed white line represents the micrometastasis area, scale bar: 50 µm (A). The metastatic potential was quantified as the percentage of xenografts that present micrometastasis in the CHT at 5dpi (B). Results are from three independent experiments and expressed as mean ± SEM. The total number of xenografts analyzed is indicated below the chart. Statistical results: ns > 0.05, * p ≤ 0.05.