
- Title
-
Rare Variants in BNC2 Are Implicated in Autosomal-Dominant Congenital Lower Urinary-Tract Obstruction
- Authors
- Kolvenbach, C.M., Dworschak, G.C., Frese, S., Japp, A.S., Schuster, P., Wenzlitschke, N., Yilmaz, Ö., Lopes, F.M., Pryalukhin, A., Schierbaum, L., van der Zanden, L.F.M., Kause, F., Schneider, R., Taranta-Janusz, K., Szczepańska, M., Pawlaczyk, K., Newman, W.G., Beaman, G.M., Stuart, H.M., Cervellione, R.M., Feitz, W.F.J., van Rooij, I.A.L.M., Schreuder, M.F., Steffens, M., Weber, S., Merz, W.M., Feldkötter, M., Hoppe, B., Thiele, H., Altmüller, J., Berg, C., Kristiansen, G., Ludwig, M., Reutter, H., Woolf, A.S., Hildebrandt, F., Grote, P., Zaniew, M., Odermatt, B., Hilger, A.C.
- Source
- Full text @ Am. J. Hum. Genet.
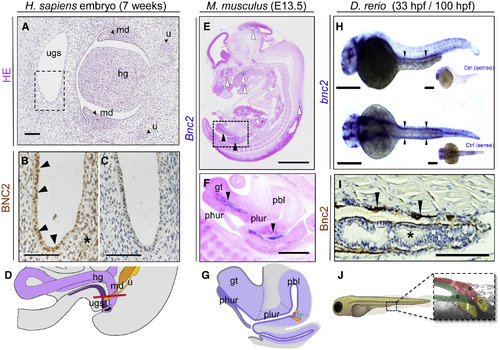
Embryonic Expression of BNC2 in Human, Murine, and ZebrafishLarvae Urinary-Tract Tissue (A) H&E-stained transverse section through a 7-week human embryo at the level of the urogenital sinus (ugs): the hindgut (hg), mesonephric ducts (md), and ureters (u) are also indicated. H. sapiens = Homo sapiens. (B) Magnification of ugs, corresponding to the boxed region in (A), shows positive BCN2 immunoreactivity (brown) in the primitive epithelium (arrowheads) and adjacent mesenchyme (asterisk). (C) There is only a faint background signal in this adjacent section in which the primary antibody was omitted. (D) Schematic overview depicting the human embryonic anatomy of the cross-section in (A). A red line indicates a sectional plane. (E and F) ISH with a pan-Bnc2 probe on a sagittal section of a representative E13.5 (TS21) mouse embryo. (E) Bnc2 expression is visible (in blue) in the brain, in the mandibular region, and in a small patch at the dorsal side above the spinal cord (white arrowheadstop to bottom). Specific expression is furthermore observed in the urogenital region (black arrowheads). (F) Magnification (square in E) of the same embryo. Cells that express Bnc2 are found in the gt above the phallic urethra (phur) and below the pelvic urethra (plur) (black arrowheads). M. musculus = Mus musculus; pbl = primitive bladder (G) Schematic overview depicting the embryonic mouse anatomy of the cross-section in E.39 (H) Whole-mount ISH with an anti bnc2 probe shows (in purple) the expression of bnc2 RNA at 33 hpf in the pronephric ducts in WT zfl. In the lateral view (top), the pronephric duct is located above the yolk extension (black arrowheads), and in the dorsal view (bottom), the pairwise anlage of pronephric ducts are positively labeled. Sense controls (ctrl) did not show a staining. D. rerio= Danio rerio. (I) Immunohistochemistry staining (in brown) against Bnc2 on a sagittal paraffin cross-section of WT zebrafish at 100 hpf indicates Bnc2-positive cells in the pronephric duct (black arrowheads) but not in the intestine (black asterisk). (J) Schematic overview of pseudo-colored cloacal region of a 4 dpf zfl for better orientation and identification (modified according to Pyati et al.).33 K = kidney (red); G = gut (green); and C = cloaca (yellow). |
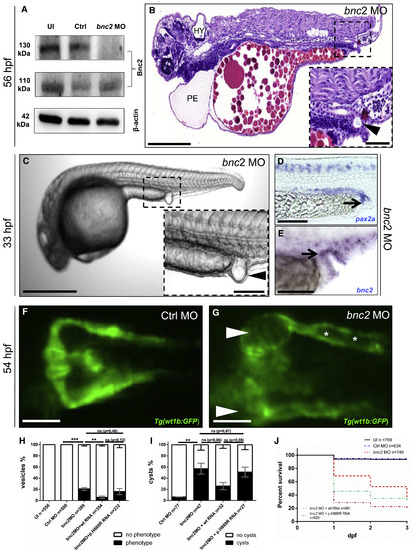
Depletion of Bnc2 Causes Pericardial Effusion, Hydrocephalus, Glomerular Cysts, and Distal Pronephric-Outlet Obstruction in Zebrafish (A) Immunoblot analysis shows a protein decrease in bnc2 MO-injected zfl for Bnc2-202 (130 kDa, C7DZJ6 according to UniProt ID) but not for Bnc2-201 (110 kDa, F1R42 according to UniProt ID) at 2 days dpf, which is as predicted for the specific MO target side. UI = uninjected. (B) H&E staining of a sagittal section of a MO-injected zfl (lateral view, head to the left) shows (PE), hydrocephalus (HY), abnormal body curvature and a “vesicle” due to an outlet obstruction of the pronephric ducts (arrowhead in enlargement in B) at 56 hpf. (C) Zfl injected with bnc2 MO frequently develop a distal-outlet obstruction at 33 hpf; this obstruction is highlighted by an arrowhead in the enlargement of (C). (D) Whole-mount ISH with a pax2a probe relates the constituent parts of the bnc2 MO-induced pronephric-outlet obstruction to distal parts of the pronephric ducts and the cloacal region (black arrow). (E) ISH with a bnc2 probe in bnc2 MO-injected embryos shows bnc2 mRNA expression in relevant tissues forming a pronephric-outlet obstruction (black arrow). (F and G) Zfl injected with bnc2 MO develop glomerular cysts (white arrowheads in G) and dilatation of the pronephric ducts (white asterisk in G). Images from in vivo observation through fluorescence microscopy (dorsal view) in Tg(wt1b:GFP) were taken at 54 hpf in zfl injected with control (Ctrl) MO (F) and bnc2 MO (G). Tg = transgenic zebrafish line. (H) The graph shows 100% of all at 1 dpf surviving zfl of the five different cohorts: UI, Ctrl MO, bnc2 MO, bnc2 MO + WT human RNA, and bnc2 MO + mutated human RNA (transcript ENST00000380672) bearing the p.His888Arg variant (for absolute numbers, see Figure 3H). A distal “vesicle” due to an outlet obstruction (phenotype) of the pronephric ducts can be seen in 21% of bnc2MO-injected zfl compared to 0% of zfl with a “vesicle” in both control groups (p < 0.05, unpaired t test). 6% of zfl injected with bnc2 MO + WT mRNA develop a “vesicle,” and so do 16% of zfl injected with bnc2 MO + p.H888R. Data are presented as means with standard error of the mean (SEM). (I) Quantification of glomerular cyst rates (phenotype) in Tg(wt1b:GFP) zfl at 2 dpf depicts significantly (p < 0.05, unpaired t test) clear glomerular cysts in 57% of bnc2 MO-injected zfl. 26% of zfl injected with bnc2 MO + WT RNA develop pronephric cysts; 51% of those injected with bnc2 MO + p.His888Arg RNA develop pronephric cysts. Data are presented as means with SEM. (J) Quantification of death rates at up to 3 dpf shows an increased mortality up to 64% in bnc2 MO-injected zfl compared to zfl injected with UI (7%) and Ctrl MO (6%). With bnc2 MO injected, zfl show significantly (p < 0.0001, Mantel-Cox test) reduced survival. Co-injection of bnc2 MO + human WT RNA results in a mortality of 69%. Aggravated mortality up to 81% can be detected in the zfl injected with bnc2 MO + p.His888Arg RNA. Scale bars represent 200 μm (B), 50 μm (magnification in B), 500 μm (C), 100 μm (magnification in C), and 100 μm (D–G). ∗∗p < 0.005, ∗∗∗ p < 0.0005. EXPRESSION / LABELING:
PHENOTYPE:
|
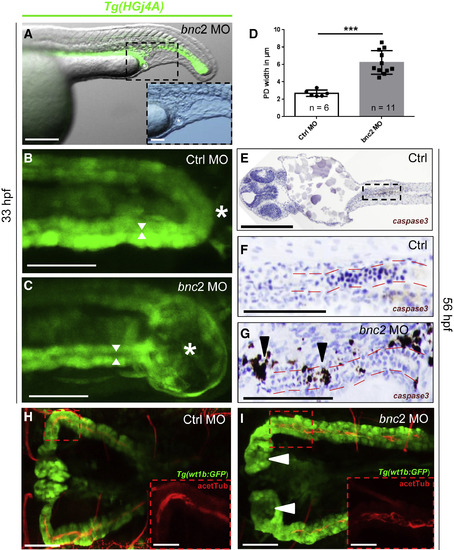
Distal Pronephric-Outlet Obstruction Is Formed by Pronephric Tissue and Causes Dilated Pronephric Ducts and Increased Apoptosis (A) Tg(HGj4A) GFP-reporter zfl (lateral view) injected with bnc2 MO emphasize the belonging of the distal pronephric-outlet obstruction, visible as a “vesicle” (marked with a white asterisk), to the distal pronephric duct and cloaca. The enlarged inlay shows the same “vesicle” in the sole bright-field image. (B and C) High-resolution two-photon microscopy dorsal view of the cloacal region (white asterisks) in Tg(HGj4A) zfl injected with Ctrl MO (B) and bnc2 MO (C) indicates the intimate relation of the pronephric-outlet obstruction to the bilateral pronephric ducts. Widths of the pronephric-duct lumen are indicated with white arrows. (D) Quantification of pronephric-duct widths in Tg(HGj4A) zfl injected with bnc2 MO shows significantly (p = 0.0002, Student’s t test) dilated pronephric ducts compared to controls. PD = pronephric ducts. Data are presented as means with SEM. (E–G) Cleaved caspase 3 staining in bnc2 MO-injected zfl (56 hpf) shows an increased rate of apoptosis (black arrowheads in G) compared to Ctrl MO-injected embryos (E–F) around the pronephric duct (marked by red lines), the cloacal region, and the central nervous system (not shown). An overview emphasizing and localizing the pronephric regions shown in (F) and (G) is shown in €. (H and I) Dorsal image from immunofluorescence staining of acetylated tubulin-stained cilia (red, acetTub) and GFP (green) depicts normal cilia morphology in the pronephric ducts in Tg(wt1b:GFP) zfl injected with Ctrl MO (H) and bnc2 MO (I) at 56 hpf. Pronephric ducts are widened in the bnc2 MO zfl as mentioned before. White arrowheads point to glomerular cysts in the bnc2MO zfl. The sole acetylated-tubulin stain (red channel) emphasizes cilia morphology in the respective enlargement inlays of (H) and (I). Scale bars represent 200 μm (A), 50 μm (magnification of A–C), 100 μm (E–G), 50 μm (H and I), and 25 μm (magnifications of H and I). ∗∗∗ p < 0.0005. PHENOTYPE:
|
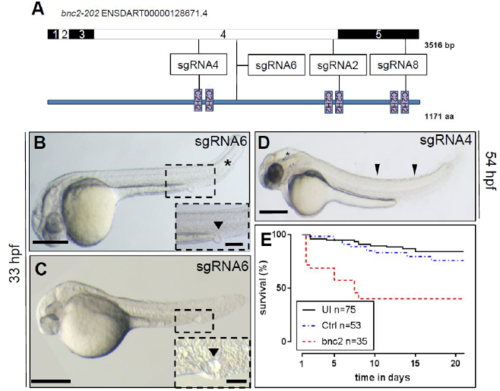
Transient Bnc2 CRISPR/Cas9 Knockdown in Zebrafish Larvae Reproduces the Morpholino Phenotype (A): Schematic showing the genomic positions of the different guide-RNAs used for the transient Bnc2 CRISPR/Cas9 targeting experiments. (B-C): Single guide RNA (sgRNA) injections of guide 6 targeting bnc2 with Cas9 reproduces the distal ‘vesicle’ as an outlet obstruction of the pronephric ducts in 5 % of injected embryos at 33 hpf (see inlays - black arrowheads). Kinked tails were observed in 1 % of the zfl (black asterisk). (D): Follow-up of sgRNA injected zfl targeting bnc2 for sgRNA 4 shows hydrocephalus (black asterisk) and light body curvature (black arrowheads) at 54 hpf. (E): Kaplan-Meier plots for survival of acute multi sgRNA (mgRNA) approach for guides 2, 6 and 8 targeting bnc2 with Cas9. Zfl were included in survival experiment after 24 hpf. Injected larvae show significantly (p<0.0001, Mantel-Cox test) reduced survival (median survival of 7 dpf) and 40 % survival at the end of the experiment. Scale bars: 500 μm (B, C and D) |
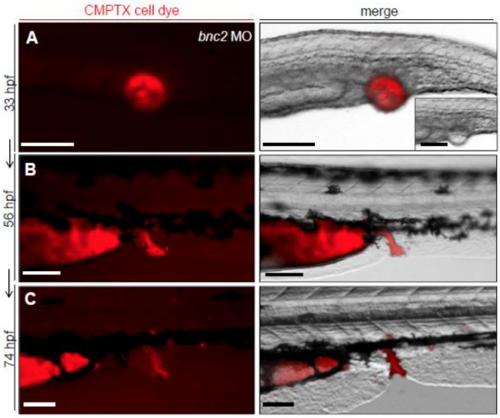
Injection of Fluorescent Cell Dye Tracker CMTPX Indicates Surrounding Cells of Pronephric Outlet Obstruction to Later Form Parts of Distal Pronephric Ducts and the Cloaca (A-C): Injection of fluorescent cell dye tracker CMPTX into the pronephric outlet obstruction ‘vesicle’ of a bnc2 MO injected zebrafish embryo at 33 hpf and follow-up imaging of the same individual zebrafish demonstrates that cells forming the ‘vesicle’ become part of the distal end of the pronephric ducts and the cloaca later in development (56 and 74 hpf). |