
Fig. 2
- ID
- ZDB-IMAGE-190730-25
- Genes
- Antibodies
- Publication
- Kolvenbach et al., 2019 - Rare Variants in BNC2 Are Implicated in Autosomal-Dominant Congenital Lower Urinary-Tract Obstruction
- All Figures
- Figures for Kolvenbach et al., 2019
|
Fig. 2
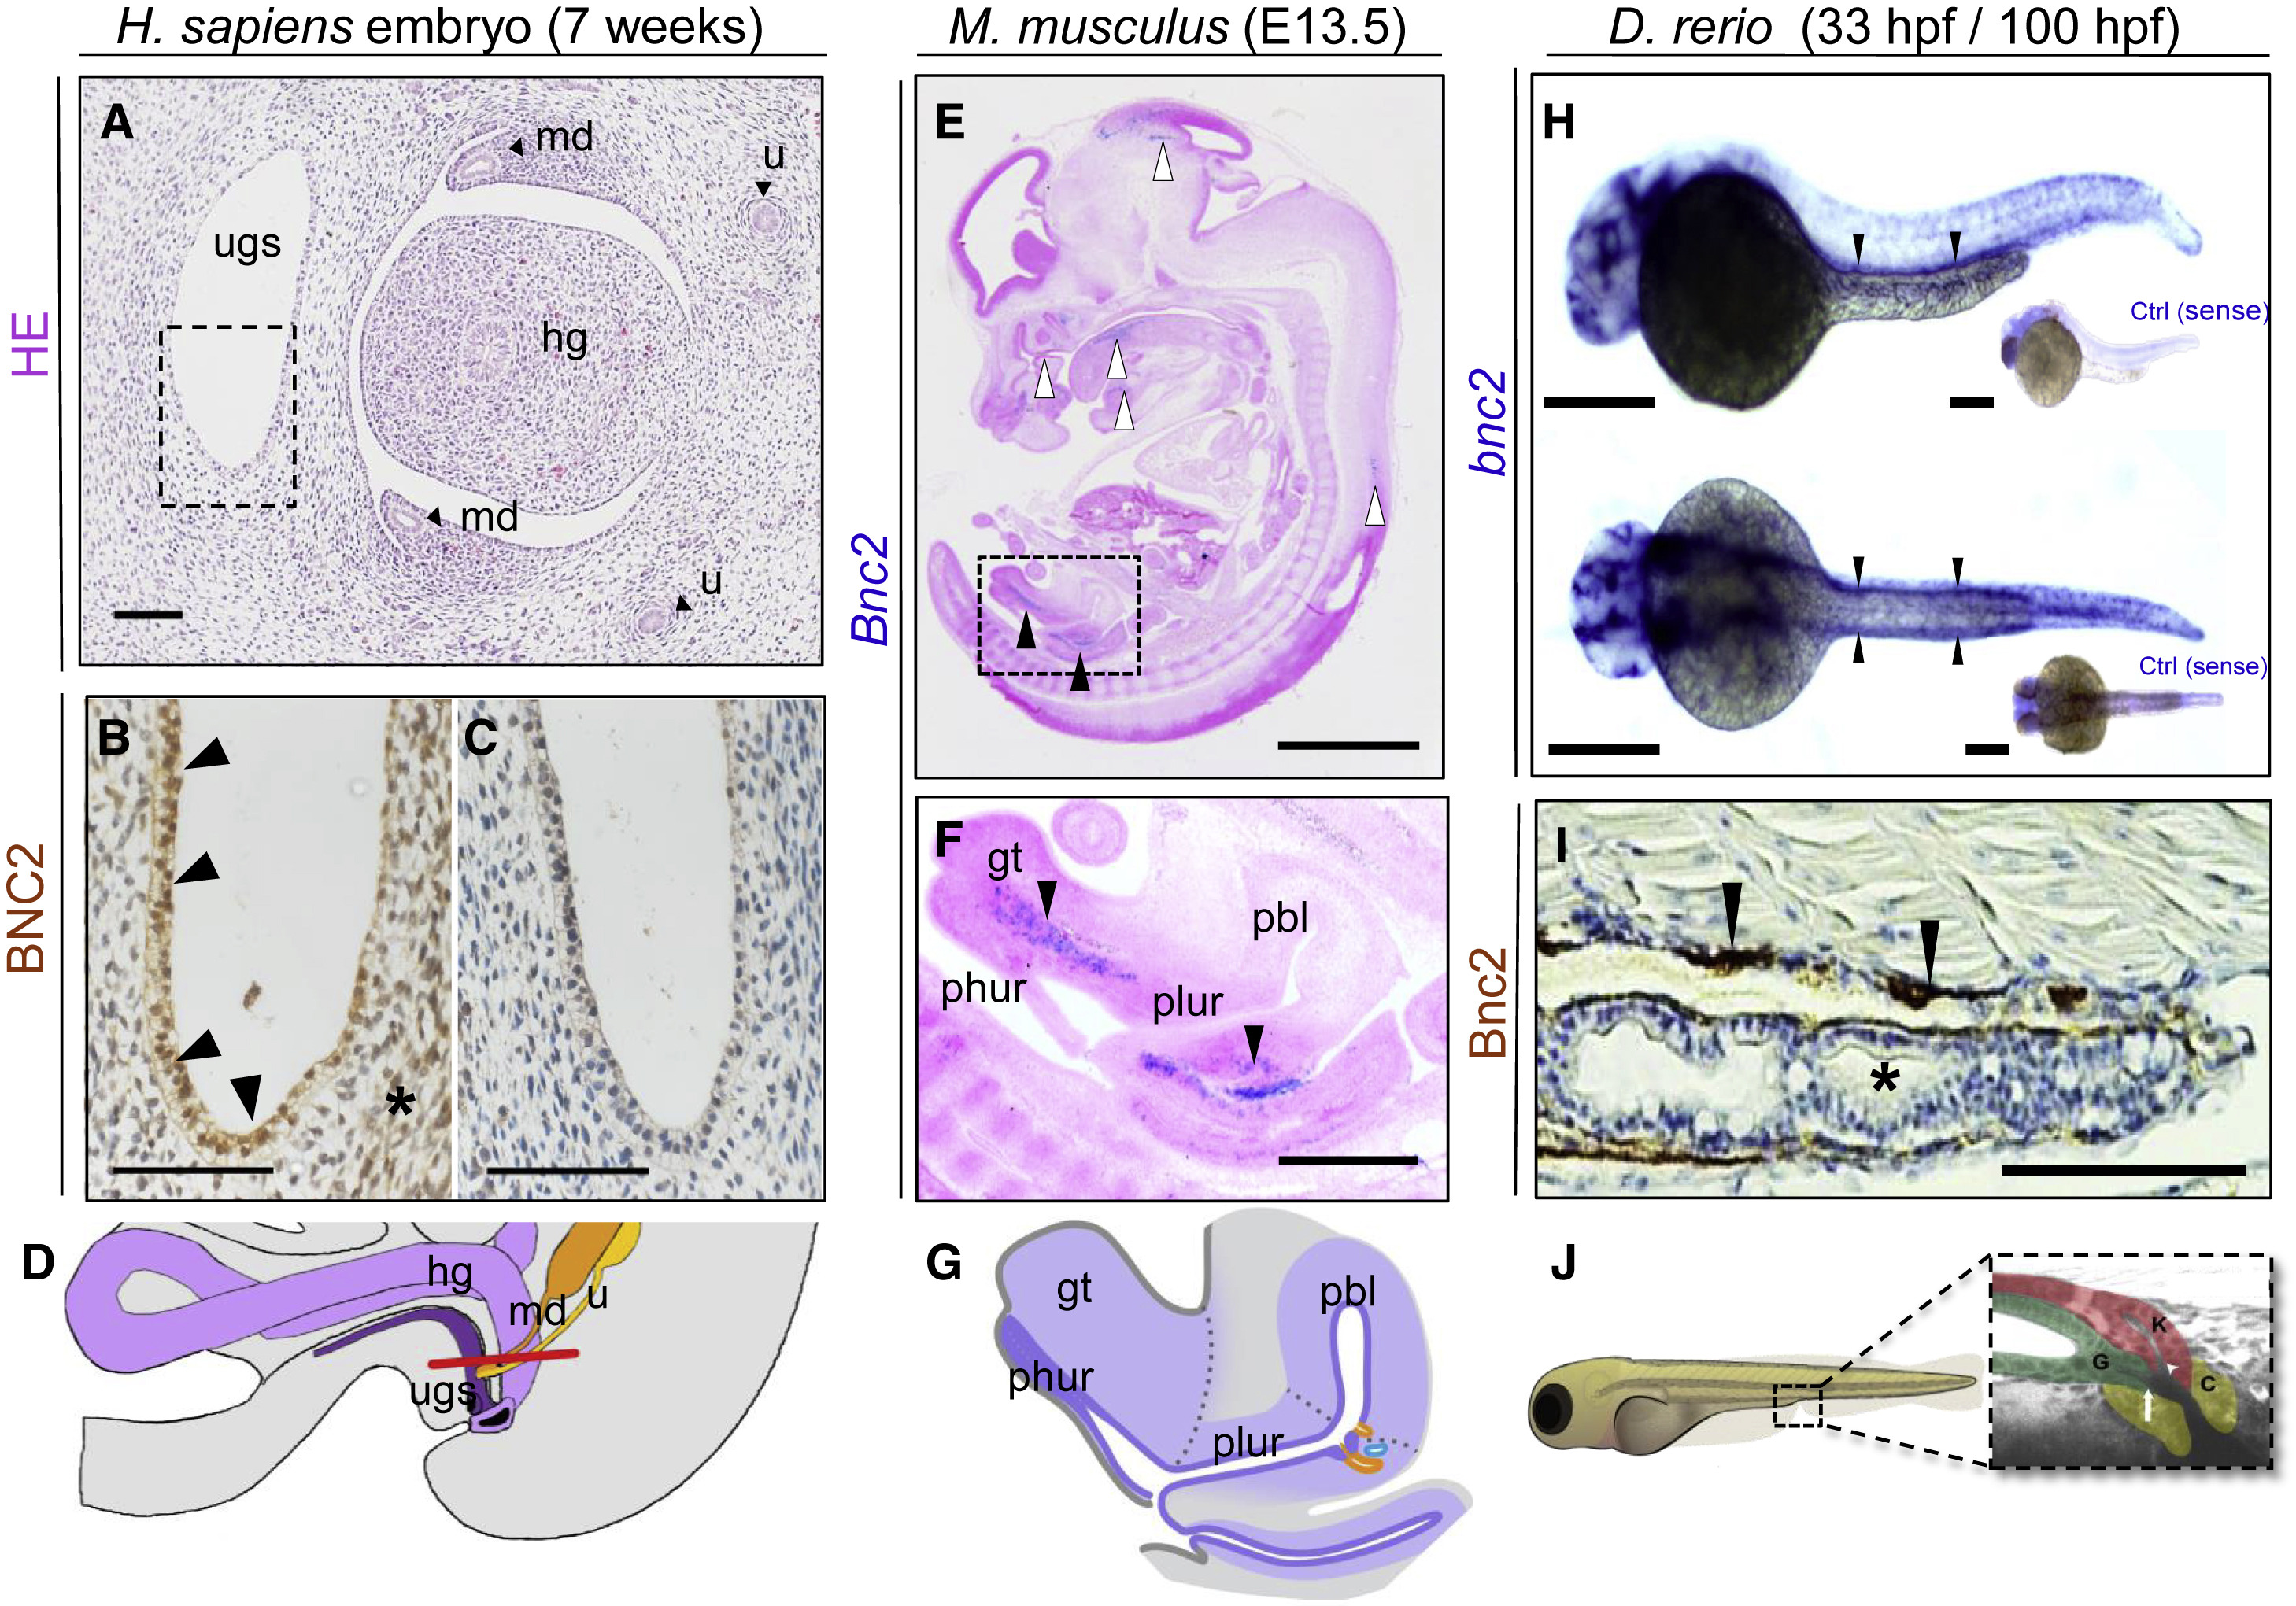
Embryonic Expression of BNC2 in Human, Murine, and ZebrafishLarvae Urinary-Tract Tissue
(A) H&E-stained transverse section through a 7-week human embryo at the level of the urogenital sinus (ugs): the hindgut (hg), mesonephric ducts (md), and ureters (u) are also indicated. H. sapiens = Homo sapiens.
(B) Magnification of ugs, corresponding to the boxed region in (A), shows positive BCN2 immunoreactivity (brown) in the primitive epithelium (arrowheads) and adjacent mesenchyme (asterisk).
(C) There is only a faint background signal in this adjacent section in which the primary antibody was omitted.
(D) Schematic overview depicting the human embryonic anatomy of the cross-section in (A). A red line indicates a sectional plane.
(E and F) ISH with a pan-Bnc2 probe on a sagittal section of a representative E13.5 (TS21) mouse embryo.
(E) Bnc2 expression is visible (in blue) in the brain, in the mandibular region, and in a small patch at the dorsal side above the spinal cord (white arrowheadstop to bottom). Specific expression is furthermore observed in the urogenital region (black arrowheads).
(F) Magnification (square in E) of the same embryo. Cells that express Bnc2 are found in the gt above the phallic urethra (phur) and below the pelvic urethra (plur) (black arrowheads). M. musculus = Mus musculus; pbl = primitive bladder
(G) Schematic overview depicting the embryonic mouse anatomy of the cross-section in E.39
(H) Whole-mount ISH with an anti bnc2 probe shows (in purple) the expression of bnc2 RNA at 33 hpf in the pronephric ducts in WT zfl. In the lateral view (top), the pronephric duct is located above the yolk extension (black arrowheads), and in the dorsal view (bottom), the pairwise anlage of pronephric ducts are positively labeled. Sense controls (ctrl) did not show a staining. D. rerio= Danio rerio.
(I) Immunohistochemistry staining (in brown) against Bnc2 on a sagittal paraffin cross-section of WT zebrafish at 100 hpf indicates Bnc2-positive cells in the pronephric duct (black arrowheads) but not in the intestine (black asterisk).
(J) Schematic overview of pseudo-colored cloacal region of a 4 dpf zfl for better orientation and identification (modified according to Pyati et al.).33 K = kidney (red); G = gut (green); and C = cloaca (yellow).