
- Title
-
Leucine/glutamine and v-ATPase/lysosomal acidification via mTORC1 activation are required for position-dependent regeneration
- Authors
- Takayama, K., Muto, A., Kikuchi, Y.
- Source
- Full text @ Sci. Rep.
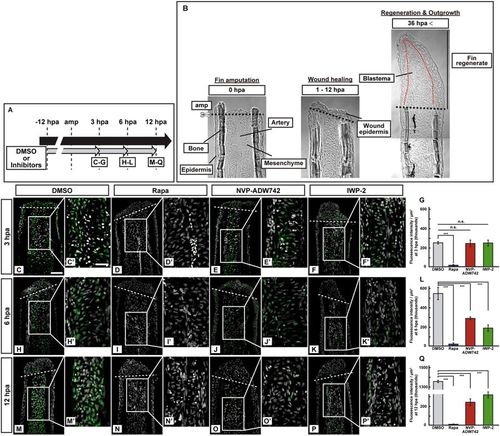
Activation of S6K was not inhibited by pharmacological inhibitors of IGF or Wnt signaling at 3 hpa. (A) Scheme of inhibitor treatments for rapamycin (a mTORC1 inhibitor), NVP-ADW742 (an IGF-1R inhibitor), and IWP-2 (a Wnt/β-catenin inhibitor) from −12 to 12 hpa. (B) Bright-field images of longitudinal ray sections of wild-type (WT) stumps (0 and 1–12 hpa) and fin regenerates (36 hpa). Black and red dotted lines indicate the amputation planes (amp) and the border between epidermis and blastema, respectively. (C–F’,H–K’, and M–P’) Longitudinal ray sections of DMSO- or inhibitors-treated WT fin stumps that were immunohistochemically stained with an antibody against p-S6K (green) at 3, 6, and 12 hpa (n = 5). 4,6-diamidino-2-phenylindole dihydrochloride (DAPI) fluorescent signal (grayscale; pseudo color) indicates the presence of nuclei. Representative images used for quantification are shown in (G,L, and Q) along with a highly magnified view. White dashed lines indicate the amputation planes. Scale bars: 50 μm (C–F,H–K, and M–P) and 25 μm (C’–F’,H’–K’, and M’–P’). (G,L, and Q) Quantification of the p-S6K fluorescence intensities per area that consist of the whole regenerates and 500 μm below the amputation plane (including the intra-ray, epidermal, and wound epidermal cells) in rapamycin-, NVP-ADW742-, or IWP-2-treated fin stumps at 3 (G), 6 (L), and 12 (Q) hpa (n = 5). n.s.: not significant. ***p < 0.001 by Student’s t test. Error bars represent the standard error. |
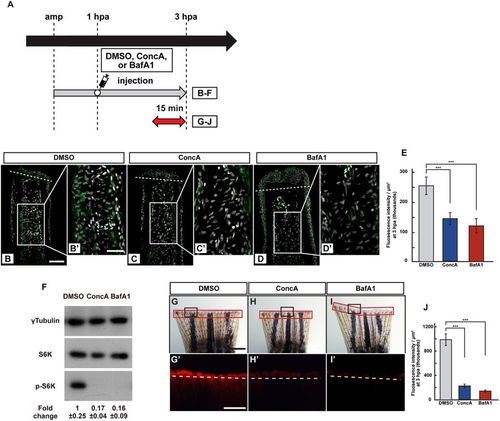
v-ATPase activity is required for the S6K activation. (A) Experimental scheme. DMSO, ConcA, or BafA1 solution was injected into the amputated fins at 1 hpa. The red two-headed-arrow indicates LysoTracker treatment, which was applied 15 min before observation. (B–E) Longitudinal ray sections and quantification of p-S6K fluorescence intensities per area that consist of the whole regenerates and 500 μm below the amputation plane in DMSO-, ConcA-, or BafA1-treated fin stumps at 3 hpa; p-S6K and nuclei were visualized by immunohistochemical staining and DAPI staining, respectively (n = 5). Representative images (B–D’) used for quantification are shown in (E). White dashed lines indicate the amputation planes. Scale bars: 50 μm (B–D) and 25 μm (B’–D’). ***p < 0.001 by Student’s t test. Error bars represent the standard error. (F) Western blotting analysis of γTubulin, S6K, and p-S6K in the DMSO-, ConcA-, or BafA1-treated fin stumps at 3 hpa (n = 6). γTubulin serves as a loading control. Numbers below each lane show the level of p-S6K in ConcA-, or BafA1-treated fin stumps relative to that in DMSO-treated fin stumps at 3 hpa normalized to loading control. (G–I’) Images of bright-field and fluorescence (red) microscopy, and quantification of the LysoTracker fluorescence intensity (see Materials and Methods) of DMSO-, ConcA-, or BafA1-treated fin stumps (n = 8). Black boxed areas in (G–I) are enlarged in (G’–I’), respectively. The LysoTracker fluorescence intensities in red boxed areas were measured (G–I’). Representative images (G’–I’) used for quantification are shown in (J). White dashed lines indicate the amputation planes. Scale bars: 1 mm (G–H) and 500 μm (G’–H’). ***p < 0.001 by Student’s t test. Error bars represent the standard error. |
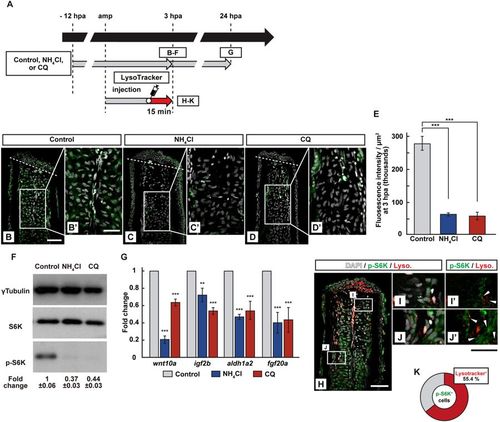
Requirement of lysosomal acidification in the S6K activation. (A) Experimental scheme. NH4Cl or chloroquine (CQ) was treated from −12 to 3 or 24 hpa (B–G). LysoTracker solution was injected into the amputated fins 15 min before fixation (H–K). (B–E) Longitudinal ray sections and quantification of p-S6K fluorescence intensities per area that consist of the whole regenerates and 500 μm below the amputation plane in control, NH4Cl-, or CQ-treated fin stumps at 3 hpa; p-S6K and nuclei were visualized by immunohistochemical staining and DAPI staining, respectively (n = 5). Representative images (B–D’) used for quantification are shown in (E). White dashed lines indicate the amputation planes. Scale bars: 50 μm (B–D) and 25 μm (B’–D’). ***p < 0.001 by Student’s t test. Error bars represent the standard error. (F) Western blotting analysis of γTubulin, S6K, and p-S6K in the DMSO-, NH4Cl-, or CQ-treated fin stumps at 3 hpa. γTubulin serves as a loading control. Numbers below each lane show the level of p-S6K in NH4Cl-, or CQ-treated fin stumps relative to that in DMSO-treated fin stumps at 3 hpa normalized to loading control. (G) The relative expression of growth factor-related genes in NH4Cl- or CQ-treated fin stumps by qPCR at 24 hpa. ***p < 0.001, **p < 0.05 by Student’s t test. Error bars represent the standard error. (H–K) Longitudinal ray sections and quantification of p-S6K+ and LysoTracker fluorescence+ cells in area that consist of the whole regenerates and 500 μm below the amputation plane at 3 hpa; p-S6K (green), nuclei (grayscale), and lysosomal acidification (red) were visualized by immunohistochemical staining, DAPI, and LysoTracker (Lyso.), respectively (n = 8). White boxed areas in (H) are enlarged in (I–J’), respectively. Representative images (H–J’) used for quantification are shown in (K). Arrowheads in (I’ and J’) indicate LysoTracker fluorescence and p-S6K double positive cells. Scale bars: 50 μm (H) and 25 μm (I–J’). A pie chart shows that 55.4% of p-S6K+ cells are the LysoTracker fluorescence positive cells (K). |
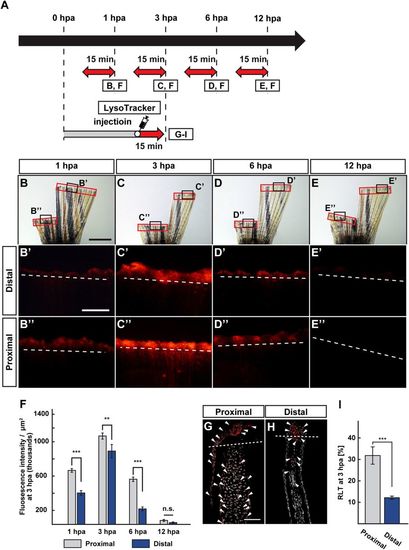
Position-dependent lysosomal acidification during fin regeneration. (A) Experimental scheme. Red two-headed-arrows indicate LysoTracker treatment, which was applied 15 min before observation. For cryosections, LysoTracker solution was injected into the amputated fins 15 min before fixation. (B–E”) Bright-field and fluorescent images of LysoTracker-treated fins at 1, 3, 6, and 12 hpa (n = 5). Black boxed areas in (B–E) are enlarged in (B’–E’ and B”–E”), respectively. The LysoTracker fluorescence intensities in red boxed areas were measured (B–E”). Representative images (B’–E”) used for quantification are shown in (F). White dashed lines indicate the amputation planes. Scale bars: 3 mm (B–E) and 500 μm (B’–E’ and B”–E”). (F) Quantification of Lysotracker fluorescence intensities at the proximal and distal positions at 1, 3, 6, and 12 hpa (n = 5). n.s.: not significant. ***p < 0.001, **p < 0.05 by Student’s t test. Error bars represent the standard error. (G–I) Longitudinal ray sections and quantification of ratios of LysoTracker fluorescence-positive cell number/total cell number (RLTs) within 500 μm of the amputation plane at 3 hpa (n = 5). Representative images (G,H) used for quantification are shown in (I). Arrowheads indicate LysoTracker fluorescence-positive cells (red). Scale bars: 50 µm (G,H) n.s.: not significant. ***p < 0.001 by Student’s t test. Error bars represent the standard error. |
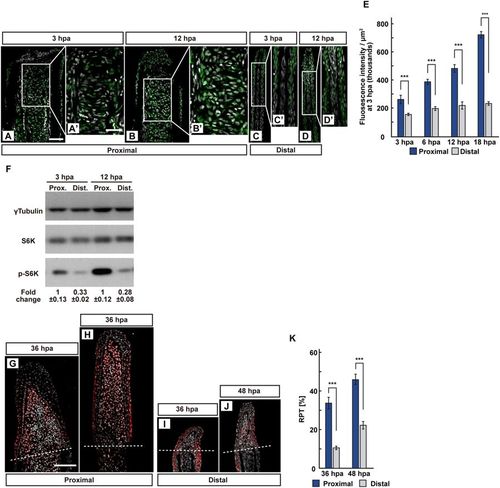
The position-dependent activation of S6K during fin regeneration. (A–E) Longitudinal ray sections (3 and 12 hpa) and quantification of p-S6K fluorescence intensities per area that consist of the whole regenerates and 500 μm below the amputation plane (3, 6, 12, and 18 hpa) of proximal and distal positions in WT fins; p-S6K and nuclei were visualized by immunohistochemical staining and DAPI staining, respectively (n = 8). Representative images (A–D’) used for quantification are shown in (E). White dashed lines indicate the amputation planes. Scale bars: 50 μm (A–D) and 25 μm (A’–D’). ***p < 0.001 by Student’s t test. Error bars represent the standard error. (F) Western blotting analysis of γTubulin, S6K, and p-S6K in WT fin stumps at 3 and 12 hpa. γTubulin serves as a loading control. Numbers below each lane show the level of p-S6K in proximal fin stumps relative to that in distal fin stumps at 3 or 12 hpa normalized to loading control, respectively. (G–J) Longitudinal ray sections of proximal and distal fins in WT fins at 36 and 48 hpa; PCNA and nuclei were visualized by immunohistochemical staining and DAPI staining, respectively (n = 5). Representative images (G–J) used for quantification are shown in (K). White dashed lines indicate the amputation planes. Scale bars: 50 μm (G–J). (K) Ratios of PCNA-positive cell number/total cell number (RPTs) in whole regenerates at 36 and 48 hpa (n = 5). ***p < 0.001 by Student’s t test. Error bars represent the standard error. |
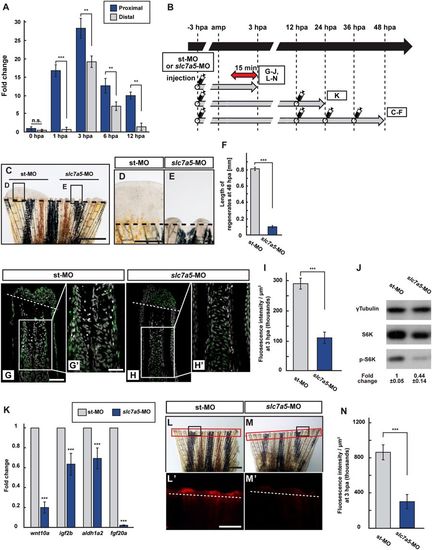
Slc7a5 is required for S6K activation and lysosomal acidification. (A) The relative expression of slc7a5 in proximal and distal fin regenerates at 0, 1, 3, 6, and 12 hpa by qPCR analyses. (B) Scheme of vivo-MO mediated knockdown experiments from −3 to 48 hpa. A red two-headed-arrow indicates LysoTracker treatment, which was applied 15 min before observation. Syringes indicate vivo-MO injection. (C–F) Outgrowth of fin regenerates and quantification of their length after being injected with standard vivo-MO (st-MO) or slc7a5 vivo-MO (slc7a5-MO) at 48 hpa (n = 5). The boxed areas in (C) are enlarged in (D and E), respectively. Representative images (C–E) used for quantification are shown in (F). Black dashed lines indicate the amputation planes. Scale bars: 1 mm (C) and 250 μm (D,E). ***p < 0.001 by Student’s t test. Error bars represent the standard error. (G–I) Longitudinal ray sections and quantification of p-S6K fluorescence intensities per area that consist of the whole regenerates and 500 μm below the amputation plane in st-MO or slc7a5-MO injected fin stumps at 3 hpa; p-S6K and nuclei were visualized by immunohistochemical staining and DAPI staining, respectively (n = 8). Representative images (G–H’) used for quantification are shown in (I). Scale bars: 50 μm (G and H) and 25 μm (G’–H’). ***p < 0.001 by Student’s t test. Error bars represent the standard error. (J) Western blotting analysis of γTubulin, S6K, and p-S6K in st-MO or slc7a5-MO injected fin stumps at 3 hpa (n = 5). γTubulin serves as a loading control. Numbers below each lane show the level of p-S6K in st-MO injected fin stumps relative to that in slc7a5-MO injected fin stumps at 3 hpa normalized to loading control. (K) The relative expression of growth factor-related genes in st-MO- or slc7a5-MO-injected fins by qPCR at 24 hpa. ***p < 0.001. Error bars represent the standard error. (L–N) Images of bright-field and fluorescence microscopy, and quantification of LysoTracker fluorescence intensities in st-MO- or slc7a5-MO-injected fin stumps at 3 hpa (n = 5). Black boxed areas in L and M are enlarged in L’ and M’, respectively. The LysoTracker fluorescence intensities in red boxed areas were measured (L–M’). Representative images (L’–M’) used for quantification are shown in (N). Scale bars: 1 mm (L and M) and 500 μm (L’ and M’). ***p < 0.001. Error bars represent the standard error. |
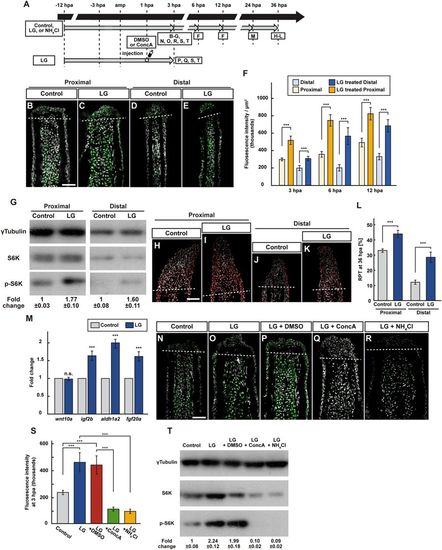
Leucine and glutamine treatment activates mTORC1 signaling via v-ATPase activity and lysosomal acidification. (A) Experimental scheme. (B–F) Longitudinal ray sections (3 hpa) and quantification of p-S6K fluorescence intensities per area that consist of the whole regenerates and 500 μm below the amputation plane (3, 6, and 12 hpa) of proximal and distal positions in control or LG-treated fin regenerates; p-S6K and nuclei were visualized by immunohistochemical staining and DAPI staining, respectively (n = 6). Representative images (B–E) used for quantification are shown in (F). White dashed lines indicate the amputation planes. Scale bars: 50 μm. ***p < 0.001 by Student’s t test. Error bars represent the standard error. (G) Western blotting analysis of γTubulin, S6K, and p-S6K in proximally and distally amputated LG-treated fin stumps at 3 hpa. γTubulin serves as a loading control. Numbers below each lane show the level of p-S6K in proximally or distally amputated LG-treated fin stumps relative to that in proximally or distally amputated control fin stumps at 3 hpa normalized to loading control, respectively. (H–L) Longitudinal ray sections and RPT quantification in proximally and distally amputated control or LG-treated fin regenerates at 36 hpa; PCNA and nuclei were visualized by immunohistochemical staining and DAPI staining, respectively (n = 5). Representative images (H–K) used for quantification are shown in (L). White dashed lines indicate the amputation planes. Scale bars: 50 μm. ***p < 0.001 by Student’s t test. Error bars represent the standard error. (M) The relative expression of growth factor-related genes in control and LG-treated fin regenerates by qPCR at 24 hpa. n.s.: not significant. ***p < 0.001 by Student’s t test. Error bars represent the standard error. (N–S) Longitudinal ray sections and quantification of p-S6K fluorescence intensities per area that consist of the whole regenerates and 500 μm below the amputation plane in control, LG-treated, LG-treated and DMSO-injected (LG + DMSO), LG-treated and ConcA-injected (LG + ConcA), or LG- and NH4Cl-treated (LG + NH4Cl) fin stumps at 3 hpa; p-S6K and nuclei were visualized by immunohistochemical staining and DAPI staining, respectively (n = 5). Representative images (N–R) used for quantification are shown in (S). White dashed lines indicate the amputation planes. Scale bars: 50 μm. ***p < 0.001 by Student’s t test. Error bars represent the standard error. (T) Western blotting analysis of γTubulin, S6K, and p-S6K in control, LG-treated, LG + DMSO, LG + ConcA, or LG + NH4Cl fin stumps at 3 hpa (n = 6). γTubulin serves as a loading control. Numbers below each lane show the level of p-S6K in LG-treated, LG + DMSO, LG + ConcA, or LG + NH4Cl fin stumps relative to that in control fin stumps at 3 hpa normalized to loading control. |
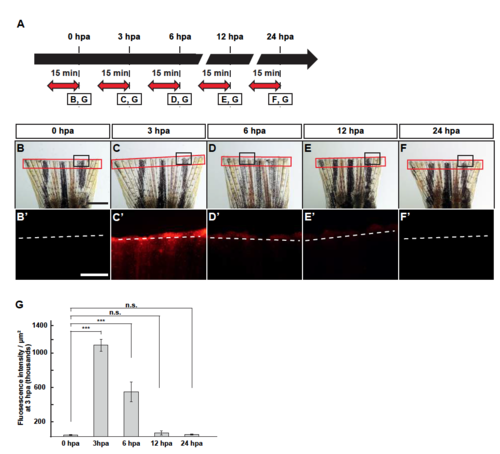
Lysosomal acidification during fin regeneration. (A) Experimental scheme. Red two-headed-arrows indicate LysoTracker treatment, which was applied 15 min before observation. (B-F’) Images of bright-field and fluorescence microscopy, and quantification of LysoTracker fluorescence intensities at 0, 3, 6, 12, and 24 hpa (n = 5). Black boxed areas in B-F are enlarged in B’-F’, respectively. The LysoTracker fluorescence intensities in red boxed areas were measured (B-F’). Representative images (B’-F’) used for quantification are shown in G. White dashed lines indicate the amputation planes. Scale bars: 1 mm (B-F) and 500µm (B’-F’). n.s.: not significant. ***p < 0.001 by Student’s t test. Error bars represent the standard error. |

Lysosomal acidification in NH4Cl- and CQ-treated fins. (A) Experimental scheme. A red two-headed-arrows indicates LysoTracker treatment, which was applied 15 min before observation. (B-E) Images of bright-field and fluorescence microscopy, and quantification of LysoTracker fluorescence intensities in control, NH4Cl-, or CQ-treated fins at 3 hpa (n = 8). Black boxed areas in B-D are enlarged in B’-D’, respectively. The LysoTracker fluorescence intensities in red boxed areas were measured (B-D’). Representative images (B’-D’) used for quantification are shown in E. White dashed lines indicate the amputation planes. Scale bars: 1 mm (B-D) and 500µm (B’-D’). ***p < 0.001 by Student’s t test. Error bars represent the standard error. |
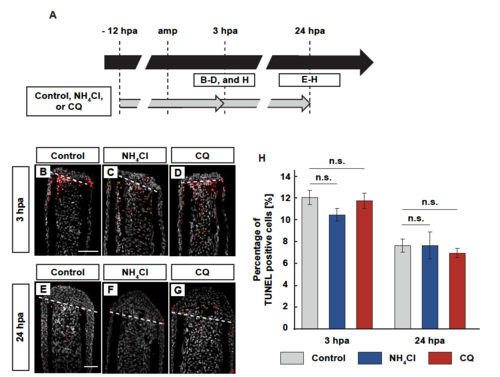
Detection of apoptotic cells by NH4Cl- or CQ-treatment. (A) Experimental scheme. NH4Cl or chloroquine (CQ) was treated from -12 to 3 or 24 hpa. (B-G) Longitudinal ray sections and quantification of TUNEL positive cells/total cell number per area that consists of the whole regenerates and 500 µm below the amputation plane in control, NH4Cl-, or CQ-treated fin stumps at 3 and 24 hpa; apoptotic cells and nuclei were visualized by immunohistochemical staining and DAPI staining, respectively (n = 5). Representative images (B-G) used for quantification are shown in H. White dashed lines indicate the amputation planes. Scale bars: 50µm (B-G). n.s.: not significant. Error bars represent the standard error. |
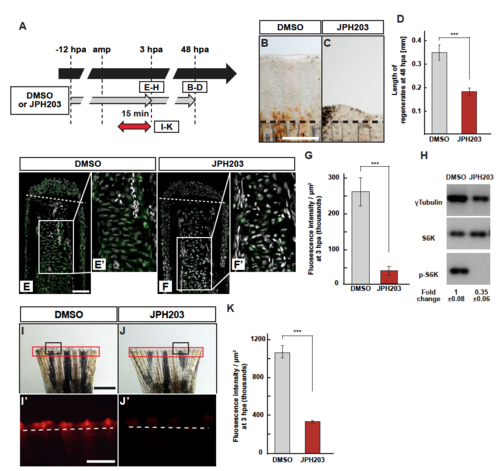
S6K activation and lysosomal acidification are inhibited by JPH203. (A) Scheme of JPH203 (Slc7a5-specific inhibitor) treatment from -12 to 3 or 48 hpa. A red two-headed-arrow indicates LysoTracker treatment, which was applied 15 min before observation. (B-D) Outgrowth of fin regenerates and quantification of their length in control or JPH203-treated fin regenerates at 48 hpa (n = 5). Representative images (B and C) used for quantification are shown in D. Black dashed lines indicate the amputation planes. Scale bars: 250µm. ***p < 0.001 by Student’s t test. Error bars represent the standard error. (E-G) Longitudinal ray sections and quantification of p-S6K fluorescence intensities per area that consists of the whole regenerates and 500 m below the amputation plane in DMSO- or JPH203-treated fin regenerates at 3 hpa; p-S6K and nuclei were visualized by immunohistochemical staining and DAPI staining, respectively (n = 5). Representative images (E-F’) used for quantification are shown in G. White dashed lines indicate the amputation planes. Scale bars: 50µm (E and F) and 25µm (E’ and F’). ***p < 0.001 by Student’s t test. Error bars represent the standard error. (H) Western blot analysis of Tubulin, S6K, and p-S6K in the DMSOor JPH203-treated fin stumps (n = 6). Tubulin serves as a loading control. Numbers below each lane show the level of p-S6K in JPH203-treated fin stumps relative to that in DMSO-treated fin stumps at 3 hpa normalized to loading control. (I-K) Images of bright-field and fluorescence microscopy, and quantification of LysoTracker fluorescence intensities in DMSO- or JPH203-treated fins at 3 hpa (n = 8). Black boxed areas in I and J are enlarged in I’ and J’, respectively. The LysoTracker fluorescence intensities in red boxed areas were measured (I-J’). Representative images (I’-J’) used for quantification are shown in K. White dashed lines indicate the amputation planes. Scale bars: 1 mm (I and J) and 500µm (I’ and J’). ***p < 0.001 by Student’s t test. Error bars represent the standard error. |
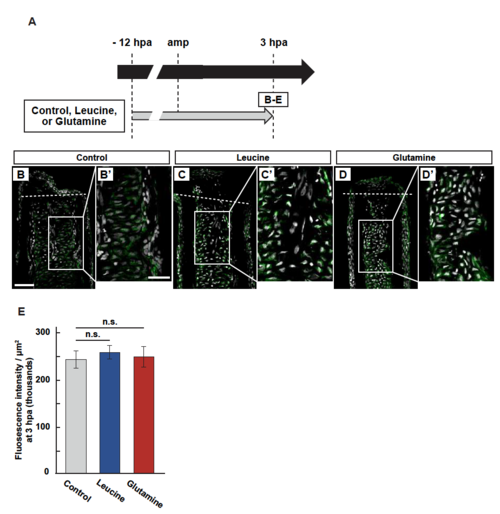
Leucine or glutamine treatment has no effect on S6K activation. (A) Experimental scheme of leucine or glutamine treatment from -12 to 3 hpa. (B-E) Longitudinal ray sections and quantification of p-S6K fluorescence intensities per area that consists of the whole regenerates and 500 µm below the amputation plane in control, leucine-, or glutamine-treated fin regenerates at 3 hpa; p-S6K and nuclei were visualized by immunohistochemical staining and DAPI staining, respectively (n = 5). Representative images (B-D’) used for quantification are shown in E. White dashed lines indicate the amputation planes. Scale bars: 50µm. n.s.: not significant. Error bars represent the standard error. |
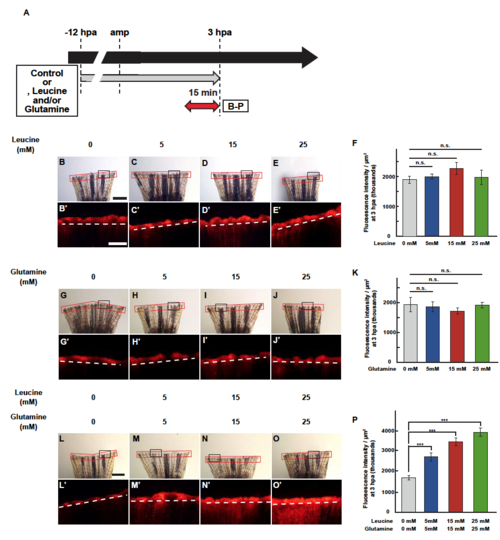
LG treatment up-regulates lysosomal acidification in a concentration-dependent manner. (A) Experimental scheme of leucine and/or glutamine treatment from -12 to 3 hpa. A red two-headed-arrow indicates LysoTracker treatment, which was applied 15 min before observation. (B-P) Images of bright-field and fluorescence microscopy, and quantification of LysoTracker fluorescence intensities in fin stumps at 3 hpa (n = 6). Black boxed areas in B-E, G-J, and L-O are enlarged in B’-E’, G’-J’, and L’-O’, respectively. The LysoTracker fluorescence intensities in red boxed area were measured (B-E’, G-J’, and L-O’). Representative images (B-E’, G-J’, and L-O’) used for quantification are shown in F, K, and P. White dashed lines indicate the amputation planes. Scale bars: 1 mm (B-E, G-J, and L-O) and 500µm (B’-E’, G’-J’, and L’-O’). ***p < 0.001 by Student’s t test. Error bars represent the standard error. |
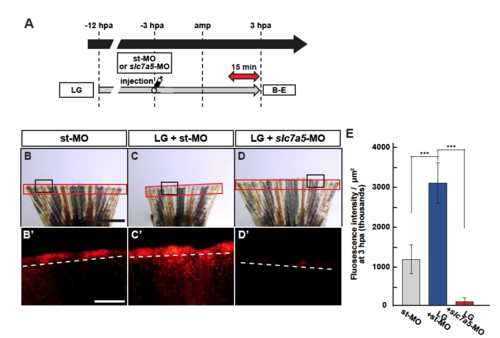
Upregulation of lysosome acidification by LG treatment is blocked by Slc7a5 knockdown. (A) Experimental scheme of LG treatment from -12 to 3 hpa. A red two-headed-arrow indicates LysoTracker treatment, which was applied 15 min before observation. A syringe indicates vivo-MO injection at -3 hpa. (B-D’) Images of bright-field and fluorescence microscopy, and quantification of LysoTracker fluorescence intensities in st-MO-, LG-treated and st-MO-injected (LG + st-MO), or LG-treated and slc7a5-MO-injected (LG + slc7a5-MO) fin stumps at 3 hpa (n = 6). Black boxed areas in B-D are enlarged in B’-D’, respectively. The LysoTracker fluorescence intensities in red boxed areas were measured (B-D’). Representative images (B’-D’) used for quantification are shown in E. Scale bars: 1 mm (B-D) and 500µm (B’-D’). ***p < 0.001. Error bars represent the standard error. |
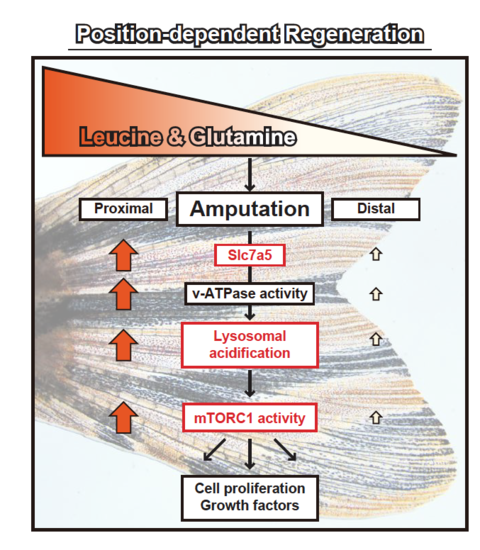
A proposed model of position-dependent fin regeneration in zebrafish. For discussion, see text. Leucine and glutamine are proximally enriched in unamputated fins. The position-dependency of slc7a5 expression, lysosomal acidification, and mTORC1 activity is found in this study (marked by red boxes |