
|
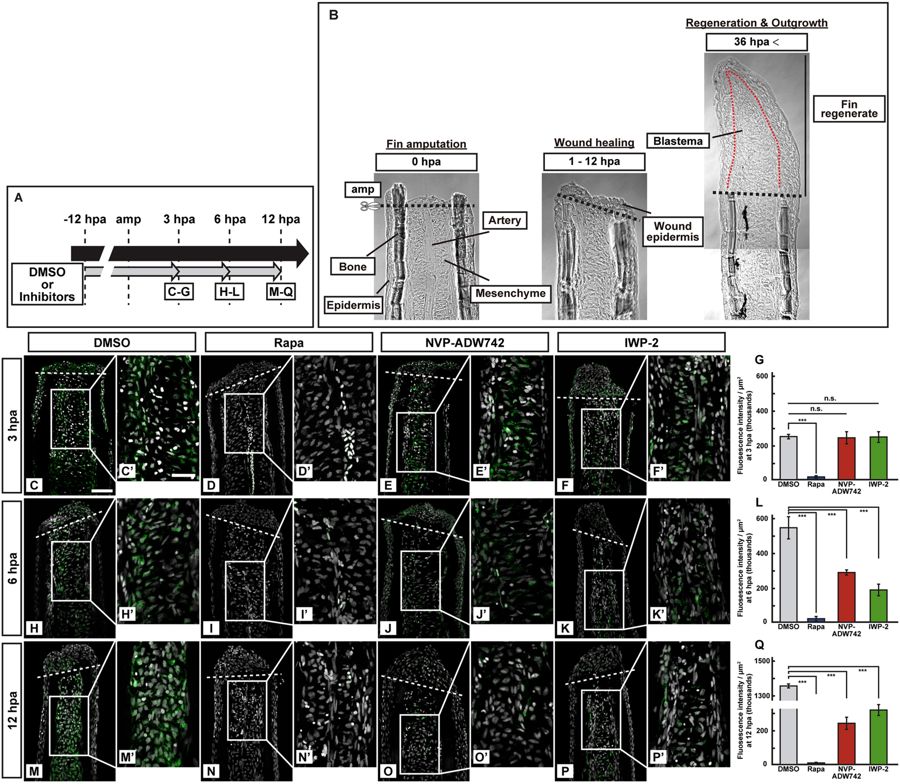
Fig. 1
Activation of S6K was not inhibited by pharmacological inhibitors of IGF or Wnt signaling at 3 hpa. (A) Scheme of inhibitor treatments for rapamycin (a mTORC1 inhibitor), NVP-ADW742 (an IGF-1R inhibitor), and IWP-2 (a Wnt/β-catenin inhibitor) from −12 to 12 hpa. (B) Bright-field images of longitudinal ray sections of wild-type (WT) stumps (0 and 1–12 hpa) and fin regenerates (36 hpa). Black and red dotted lines indicate the amputation planes (amp) and the border between epidermis and blastema, respectively. (C–F’,H–K’, and M–P’) Longitudinal ray sections of DMSO- or inhibitors-treated WT fin stumps that were immunohistochemically stained with an antibody against p-S6K (green) at 3, 6, and 12 hpa (n = 5). 4,6-diamidino-2-phenylindole dihydrochloride (DAPI) fluorescent signal (grayscale; pseudo color) indicates the presence of nuclei. Representative images used for quantification are shown in (G,L, and Q) along with a highly magnified view. White dashed lines indicate the amputation planes. Scale bars: 50 μm (C–F,H–K, and M–P) and 25 μm (C’–F’,H’–K’, and M’–P’). (G,L, and Q) Quantification of the p-S6K fluorescence intensities per area that consist of the whole regenerates and 500 μm below the amputation plane (including the intra-ray, epidermal, and wound epidermal cells) in rapamycin-, NVP-ADW742-, or IWP-2-treated fin stumps at 3 (G), 6 (L), and 12 (Q) hpa (n = 5). n.s.: not significant. ***p < 0.001 by Student’s t test. Error bars represent the standard error.