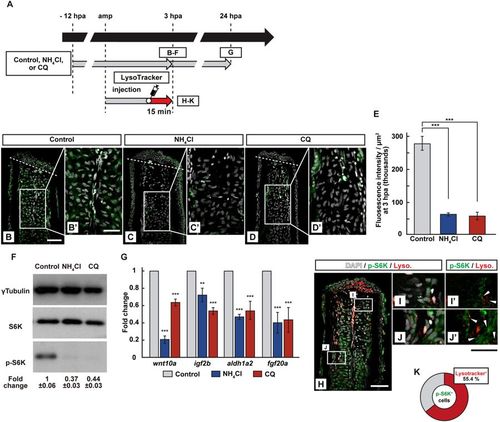
Requirement of lysosomal acidification in the S6K activation. (A) Experimental scheme. NH4Cl or chloroquine (CQ) was treated from −12 to 3 or 24 hpa (B–G). LysoTracker solution was injected into the amputated fins 15 min before fixation (H–K). (B–E) Longitudinal ray sections and quantification of p-S6K fluorescence intensities per area that consist of the whole regenerates and 500 μm below the amputation plane in control, NH4Cl-, or CQ-treated fin stumps at 3 hpa; p-S6K and nuclei were visualized by immunohistochemical staining and DAPI staining, respectively (n = 5). Representative images (B–D’) used for quantification are shown in (E). White dashed lines indicate the amputation planes. Scale bars: 50 μm (B–D) and 25 μm (B’–D’). ***p < 0.001 by Student’s t test. Error bars represent the standard error. (F) Western blotting analysis of γTubulin, S6K, and p-S6K in the DMSO-, NH4Cl-, or CQ-treated fin stumps at 3 hpa. γTubulin serves as a loading control. Numbers below each lane show the level of p-S6K in NH4Cl-, or CQ-treated fin stumps relative to that in DMSO-treated fin stumps at 3 hpa normalized to loading control. (G) The relative expression of growth factor-related genes in NH4Cl- or CQ-treated fin stumps by qPCR at 24 hpa. ***p < 0.001, **p < 0.05 by Student’s t test. Error bars represent the standard error. (H–K) Longitudinal ray sections and quantification of p-S6K+ and LysoTracker fluorescence+ cells in area that consist of the whole regenerates and 500 μm below the amputation plane at 3 hpa; p-S6K (green), nuclei (grayscale), and lysosomal acidification (red) were visualized by immunohistochemical staining, DAPI, and LysoTracker (Lyso.), respectively (n = 8). White boxed areas in (H) are enlarged in (I–J’), respectively. Representative images (H–J’) used for quantification are shown in (K). Arrowheads in (I’ and J’) indicate LysoTracker fluorescence and p-S6K double positive cells. Scale bars: 50 μm (H) and 25 μm (I–J’). A pie chart shows that 55.4% of p-S6K+ cells are the LysoTracker fluorescence positive cells (K).
|
