
|
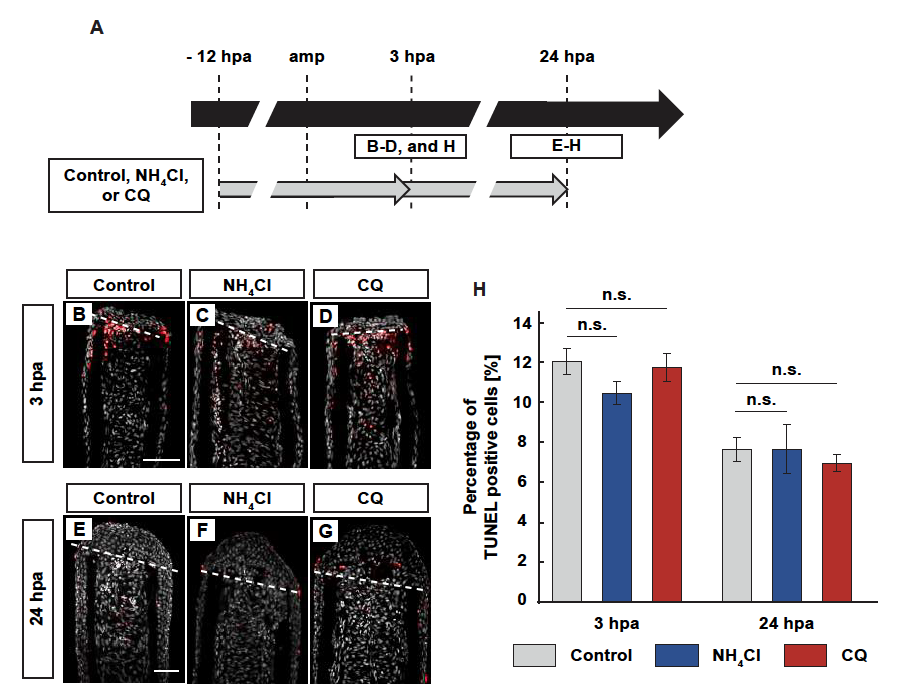
Fig. S4
Detection of apoptotic cells by NH4Cl- or CQ-treatment.
(A) Experimental scheme. NH4Cl or chloroquine (CQ) was treated from -12 to 3 or 24 hpa. (B-G) Longitudinal ray sections and quantification of TUNEL positive cells/total cell number per area that consists of the whole regenerates and 500 µm below the amputation plane in control, NH4Cl-, or CQ-treated fin stumps at 3 and 24 hpa; apoptotic cells and nuclei were visualized by immunohistochemical staining and DAPI staining, respectively (n = 5). Representative images (B-G) used for quantification are shown in H. White dashed lines indicate the amputation planes. Scale bars: 50µm (B-G). n.s.: not significant. Error bars represent the standard error.