- Title
-
A Transient Window Of Resilience During Early Development Minimizes Teratogenic Effects of Heat In Zebrafish Embryos
- Authors
- Menon, T., Nair, S.
- Source
- Full text @ Dev. Dyn.
|
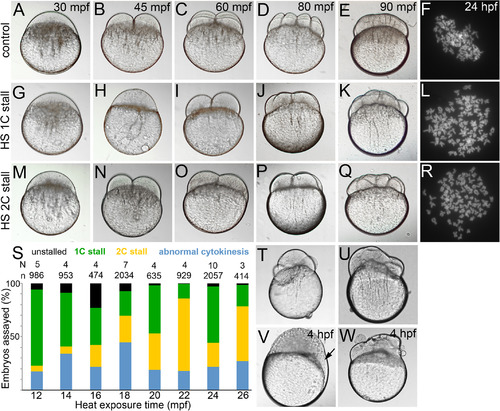
Normal cytokinesis geometries in 1C and 2C stalls. A–E,G–K,M–Q: Differential interference contrast images of live control and 1C and 2C stalls from heat shocked embryos, that are offset from controls by one‐cell division cycle each. F,L,R: Metaphase chromosome spreads at ∼30 hpf show diploid chromosome numbers in controls and tetraploid chromosome numbers in 1C and 2C stalls. S: Categories of embryos obtained across all heat shocks. T,U: Embryos undergoing abnormal cytokinesis. V,W: Abnormal cytokinesis embryos transition into embryos with acellularized patches (arrow in V) or syncytia. |
|
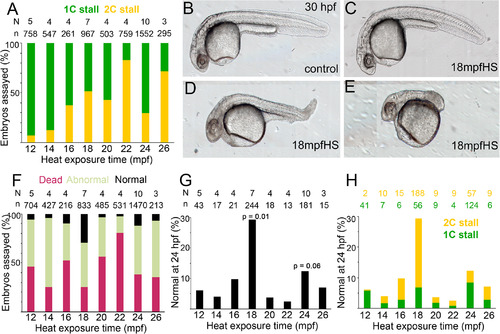
Teratogenic effects of heat and embryonic survival in transiently heat shocked embryos. A: 1C vs. 2C stall profile shows a trend to 2C stall in later heat shocks. B–E: Live morphology at ∼30 hpf of control and heat shocked embryos show varying degrees of abnormal morphologies upon heat shock. F: Embryos with normal cytokinesis geometries and cellularization before epiboly can be categorized into normal, abnormal and dead embryos at ∼24 hpf, with a significant increase in the normal category in 18 mpfHS. G: Percentage of embryos with normal morphology across all heat shocks. P‐values are for 18 mpf and 24 mpf heat shocks when compared with 12 mpf and were calculated using unpaired t‐test and Mann Whitney test. H: Contribution of 1C and 2C stalls to total percentage of embryos with normal morphologies in all heat shocks. |
|
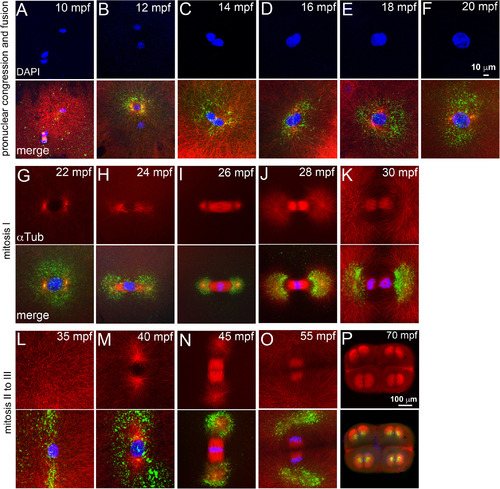
The heat shocks occur during a phase of rapidly evolving cell biology immediately after fertilization. Immunofluorescence labeling of control embryos for DNA (DAPI, blue), α‐tubulin (red) and γ‐tubulin (green). A–F: Sperm aster nucleates a microtubule monoaster and the two pronuclei congress to fuse. G–L: Mitosis‐I with prophase‐I (G), prometaphase (H), metaphase‐I (I), early (J), late (K) anaphase‐I, and telophase‐I (L). M–P: Mitosis‐II with prophase‐II (M), metaphase‐II (N), and anaphase‐II (O). P: Mitosis‐III anaphase. In panels L–O, only one of the two cells is shown. Scale bar = 10 μm in F (applies to A–F); 100 μm in P (applies to G–P). Each panel is a representative image of 7 to 10 embryos imaged for a particular time point. |
|
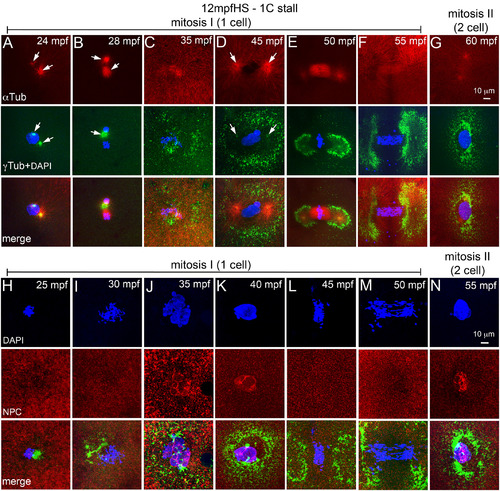
12 mpfHS delays entry into mitosis‐I and does not affect NEBD. A–G: Immunofluorescence labeling of 12 mpfHS embryos for DNA (DAPI, blue), α‐tubulin (red) and γ‐tubulin (green). Centrosomes are mispositioned (A,B), PCM recovers (C), and mitosis‐I proceeds with prophase‐I (D), metaphase‐I (E), anaphase‐I (F), and telophase‐I (G). Arrows indicate microtubule asters in the α‐tubulin panels and centrosomal foci in the γ‐tubulin panels. H–N: Immunofluorescence labeling of 12 mpfHS embryos for DNA (DAPI, blue), NPC (red), and γ‐tubulin (green). Nuclear envelope does not exist after heat shock at 12 mpf (H,I), is re‐formed at ∼35 mpf (J,K), breaks down upon entry into mitosis‐I (L,M), and re‐forms at the end of mitosis‐I (N). In panels G and N only one of the two cells is shown. For panels A–G, each panel is a representative image of 10 to 15 embryos imaged for a particular time point. For panels H–N, each panel is a representative image of 4 to 6 embryos imaged for a particular time point. |
|
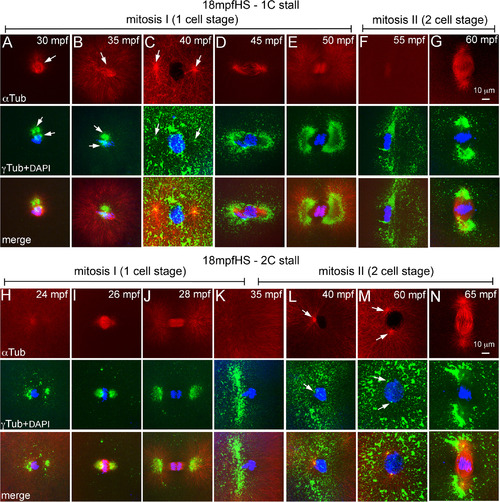
Heat shocks at end of pronuclear fusion perturbs the second centrosome duplication cycle in both 1C and 2C stalls. A–N: Immunofluorescence labelings of 18 mpfHS embryos for DNA (DAPI, blue), α‐tubulin (red), and γ‐tubulin (green). A–G: 1C stalls show loss of maternal PCM (A, B), PCM recovery and delayed entry into mitosis‐I (C), and mitosis‐I progression (D–G). H–N: 2C stalls show progression of mitosis‐I (H–K), monoasters in each cell of the two cells (L), subsequent centrosome duplication (M), and entry into mitosis‐II (N). In panels F, G, and K–N only one of the two cells is shown. Arrows indicate microtubule asters in the α‐tubulin panels and centrosomal foci in the γ‐tubulin panels. Each panel is a representative image of 9 to 17 embryos imaged for a particular time point. |
|
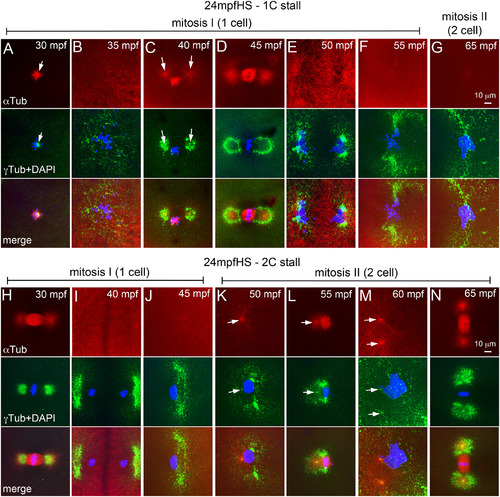
Heat shocks during mitosis‐I also perturbs the second centrosome duplication cycle in both 1C and 2C stalls. A–N: Immunofluorescence labelings of 24 mpfHS embryos for DNA (DAPI, blue), α‐tubulin (red), and γ‐tubulin (green). A‐G: 1C stalls show loss of maternal PCM (A), PCM recovery (B), and delayed entry into mitosis‐I (C) and mitosis‐I progression (D‐G). H‐N: 2C stalls show progression of mitosis‐I (H–J), monoasters in each cell of the two cells (K,L), subsequent centrosome duplication (M), and entry into mitosis‐II (N). In panels F, G, and J–N only one of the two cells is shown. Arrows indicate microtubule asters in the α‐tubulin panels and centrosomal foci in the γ‐tubulin panels. Each panel is a representative image of 11 to 28 embryos imaged for a particular time point. |
|
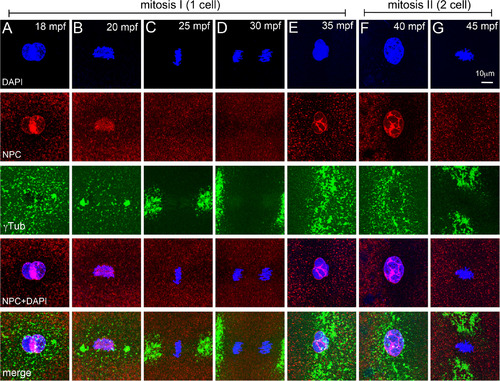
NEBD cycles during early mitosis in zebrafish embryos. A–G: Immunofluorescence labelings of control embryos for DNA (DAPI, blue), NPC (red), and γ‐tubulin (green). Nuclear envelope exists around pronuclei (A), disassembles at onset of and during mitosis‐I (B–D), re‐forms during telophase‐I (E), and exists during prophase‐II (F), but disassembles again for mitosis‐II (G). In panels E–G only one of the two cells is shown. Each panel is a representative image of 4 to 6 embryos imaged for a particular time point. |
|
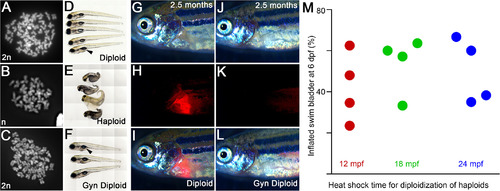
Teratogenic heat resilient developmental windows can be used for production of gynogenic diploids. A–C: Metaphase chromosome spreads show that diploids have 50 (24 hpf, A), gynogenic haploids have 25 (48 hpf, B), and heat shocked gynogenic haploids have 50 (48 hpf, C) chromosome counts, indicating a genome doubling event in the haploids upon transient heat shock. D–F: Live images at six dpf of diploids (D), haploids (E), and gynogenic diploids (F) show swim bladder inflation in diploids (D) and gynogenic diploids (F), but not in haploids (E). G–I: IVF using spermatozoa from Tg(cmlc2:mCherry) males result in transmission of the transgene from the male genome into the progeny. J–L: IVF using UV irradiated spermatozoa from Tg(cmlc2:mCherry) males produces haploids, which after a heat shock become gynogenic diploids with only the maternal nontransgene carrying genome. G,J: brightfield, H,K: cardiac mCherry fluorescence channel, I,L: merge. M: Quantification of swim bladder inflation in multiple trials of gynogenic diploids that were generated by transient heat shock of haploids at 12, 18, and 24 mpf. |

