
Image
|
Figure Caption
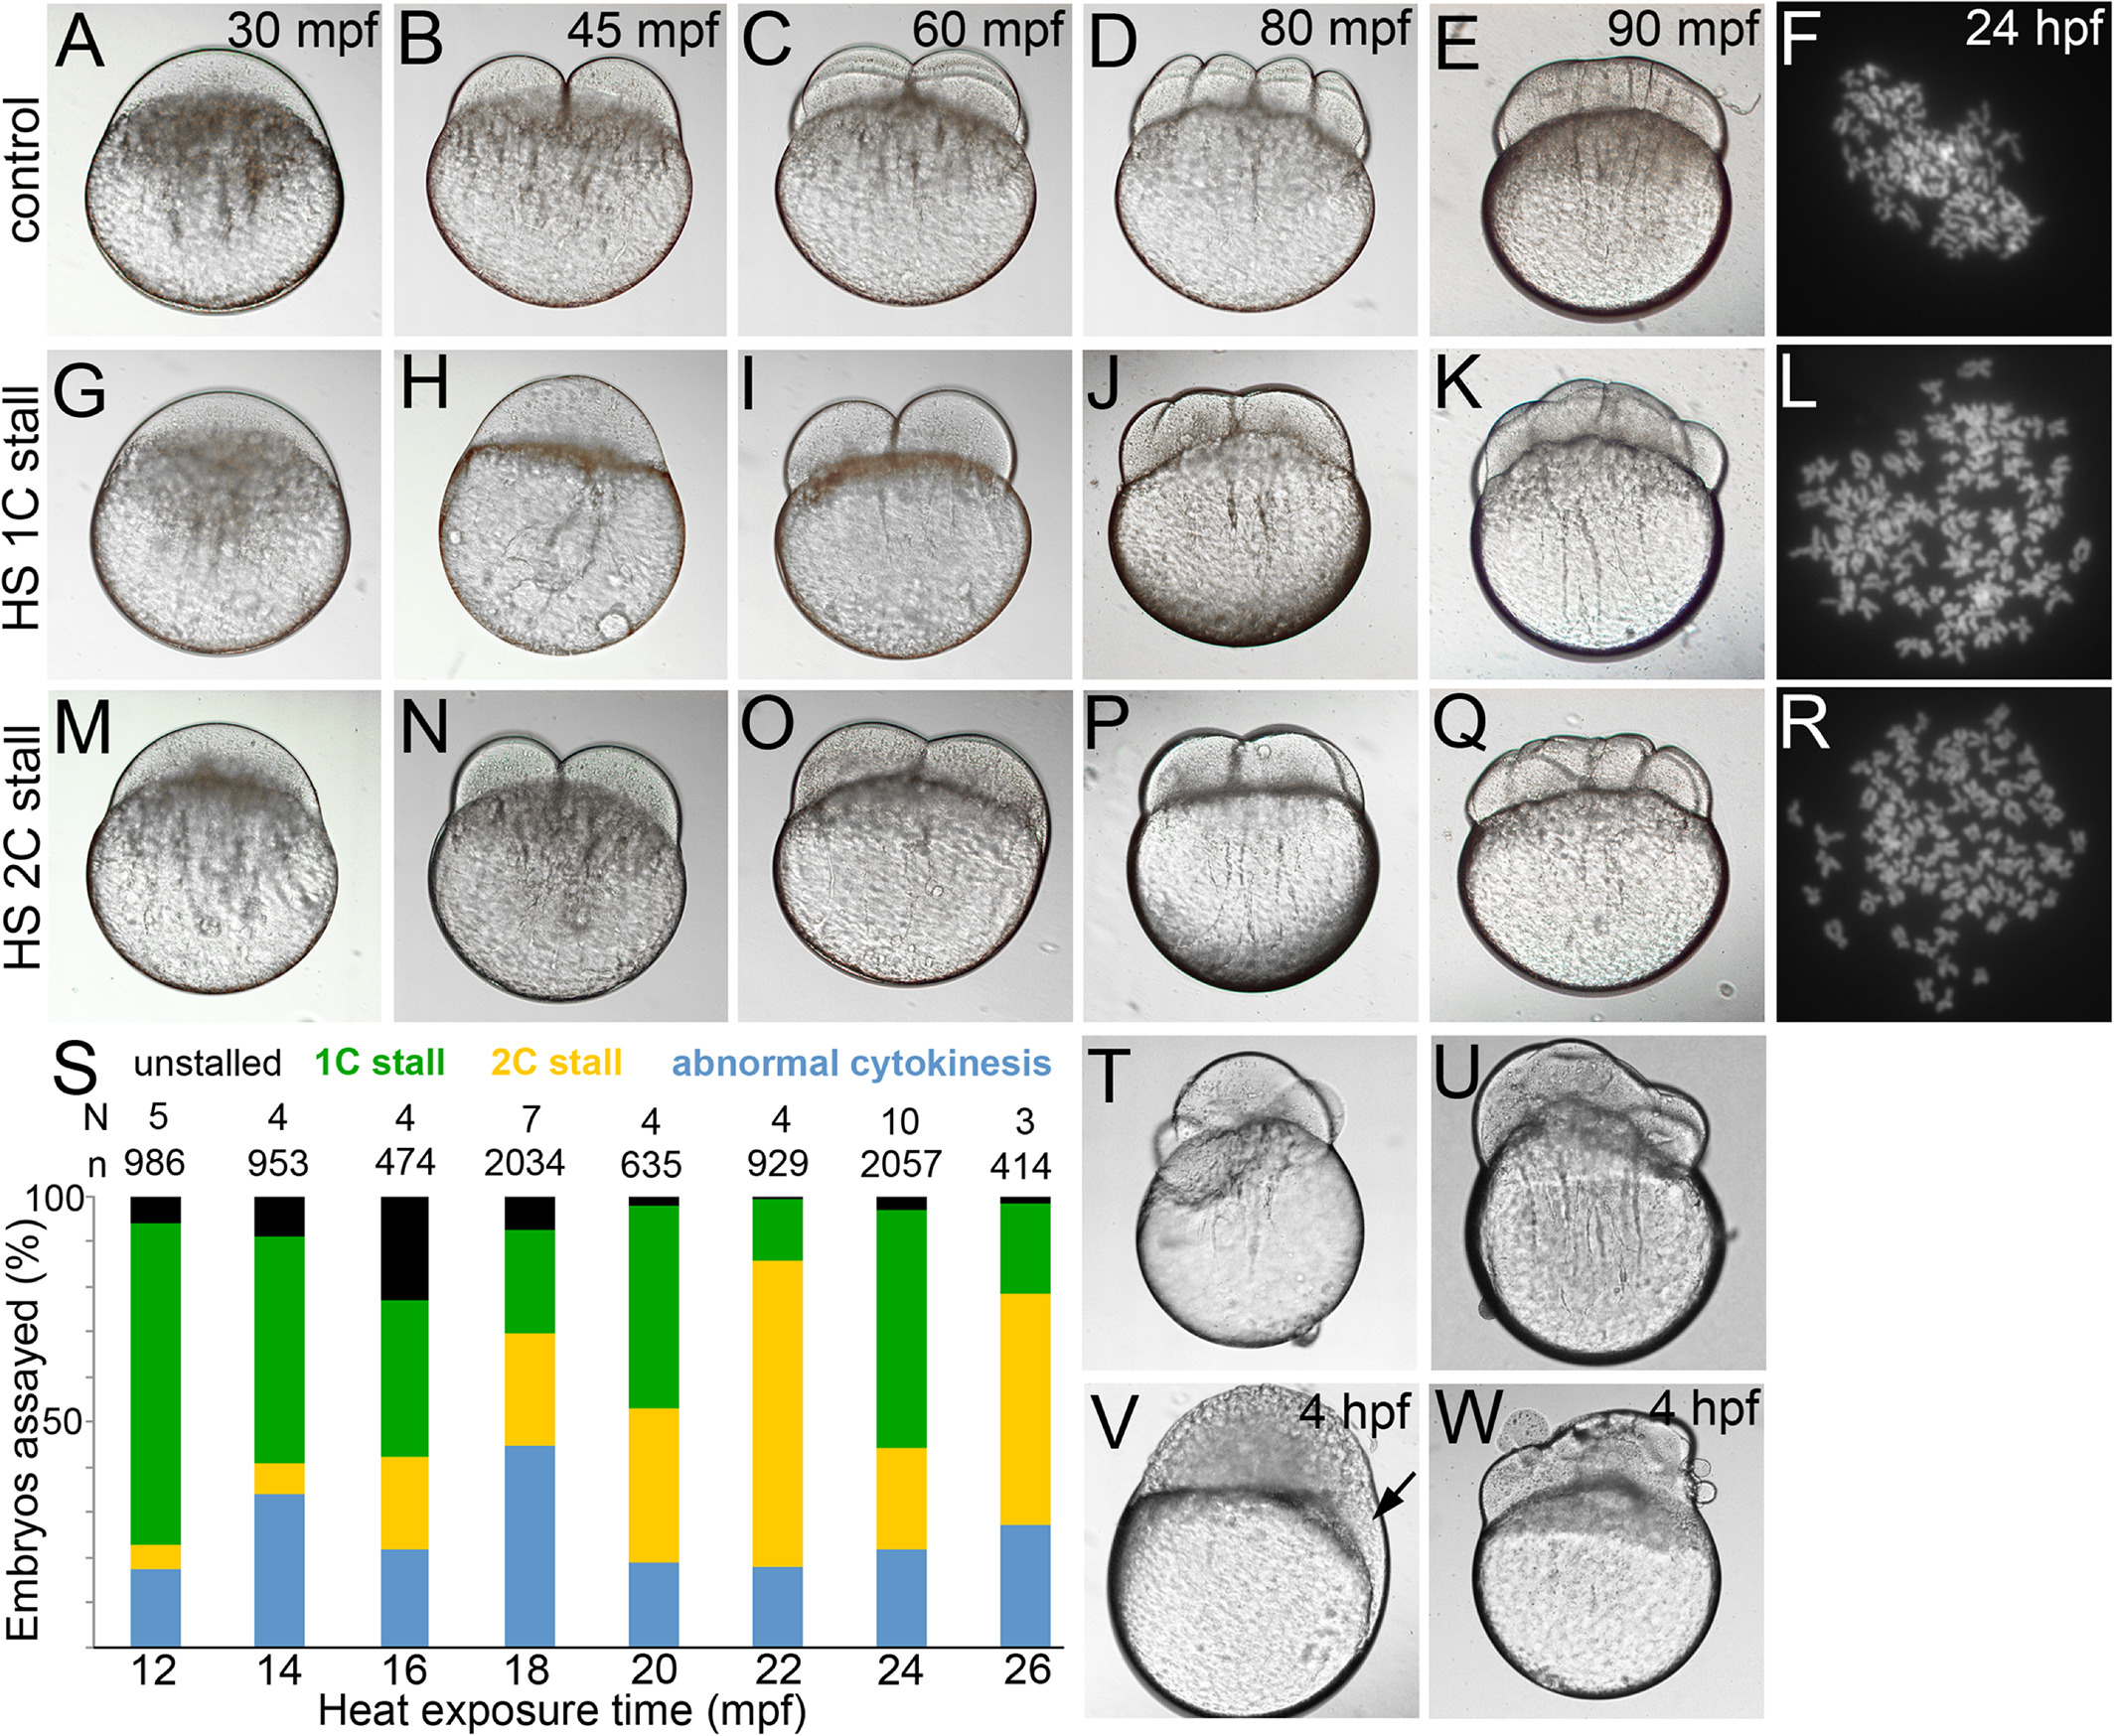
Fig. 1
Normal cytokinesis geometries in 1C and 2C stalls. A–E,G–K,M–Q: Differential interference contrast images of live control and 1C and 2C stalls from heat shocked embryos, that are offset from controls by one‐cell division cycle each. F,L,R: Metaphase chromosome spreads at ∼30 hpf show diploid chromosome numbers in controls and tetraploid chromosome numbers in 1C and 2C stalls. S: Categories of embryos obtained across all heat shocks. T,U: Embryos undergoing abnormal cytokinesis. V,W: Abnormal cytokinesis embryos transition into embryos with acellularized patches (arrow in V) or syncytia.
Acknowledgments
This image is the copyrighted work of the attributed author or publisher, and
ZFIN has permission only to display this image to its users.
Additional permissions should be obtained from the applicable author or publisher of the image.
Full text @ Dev. Dyn.