
|
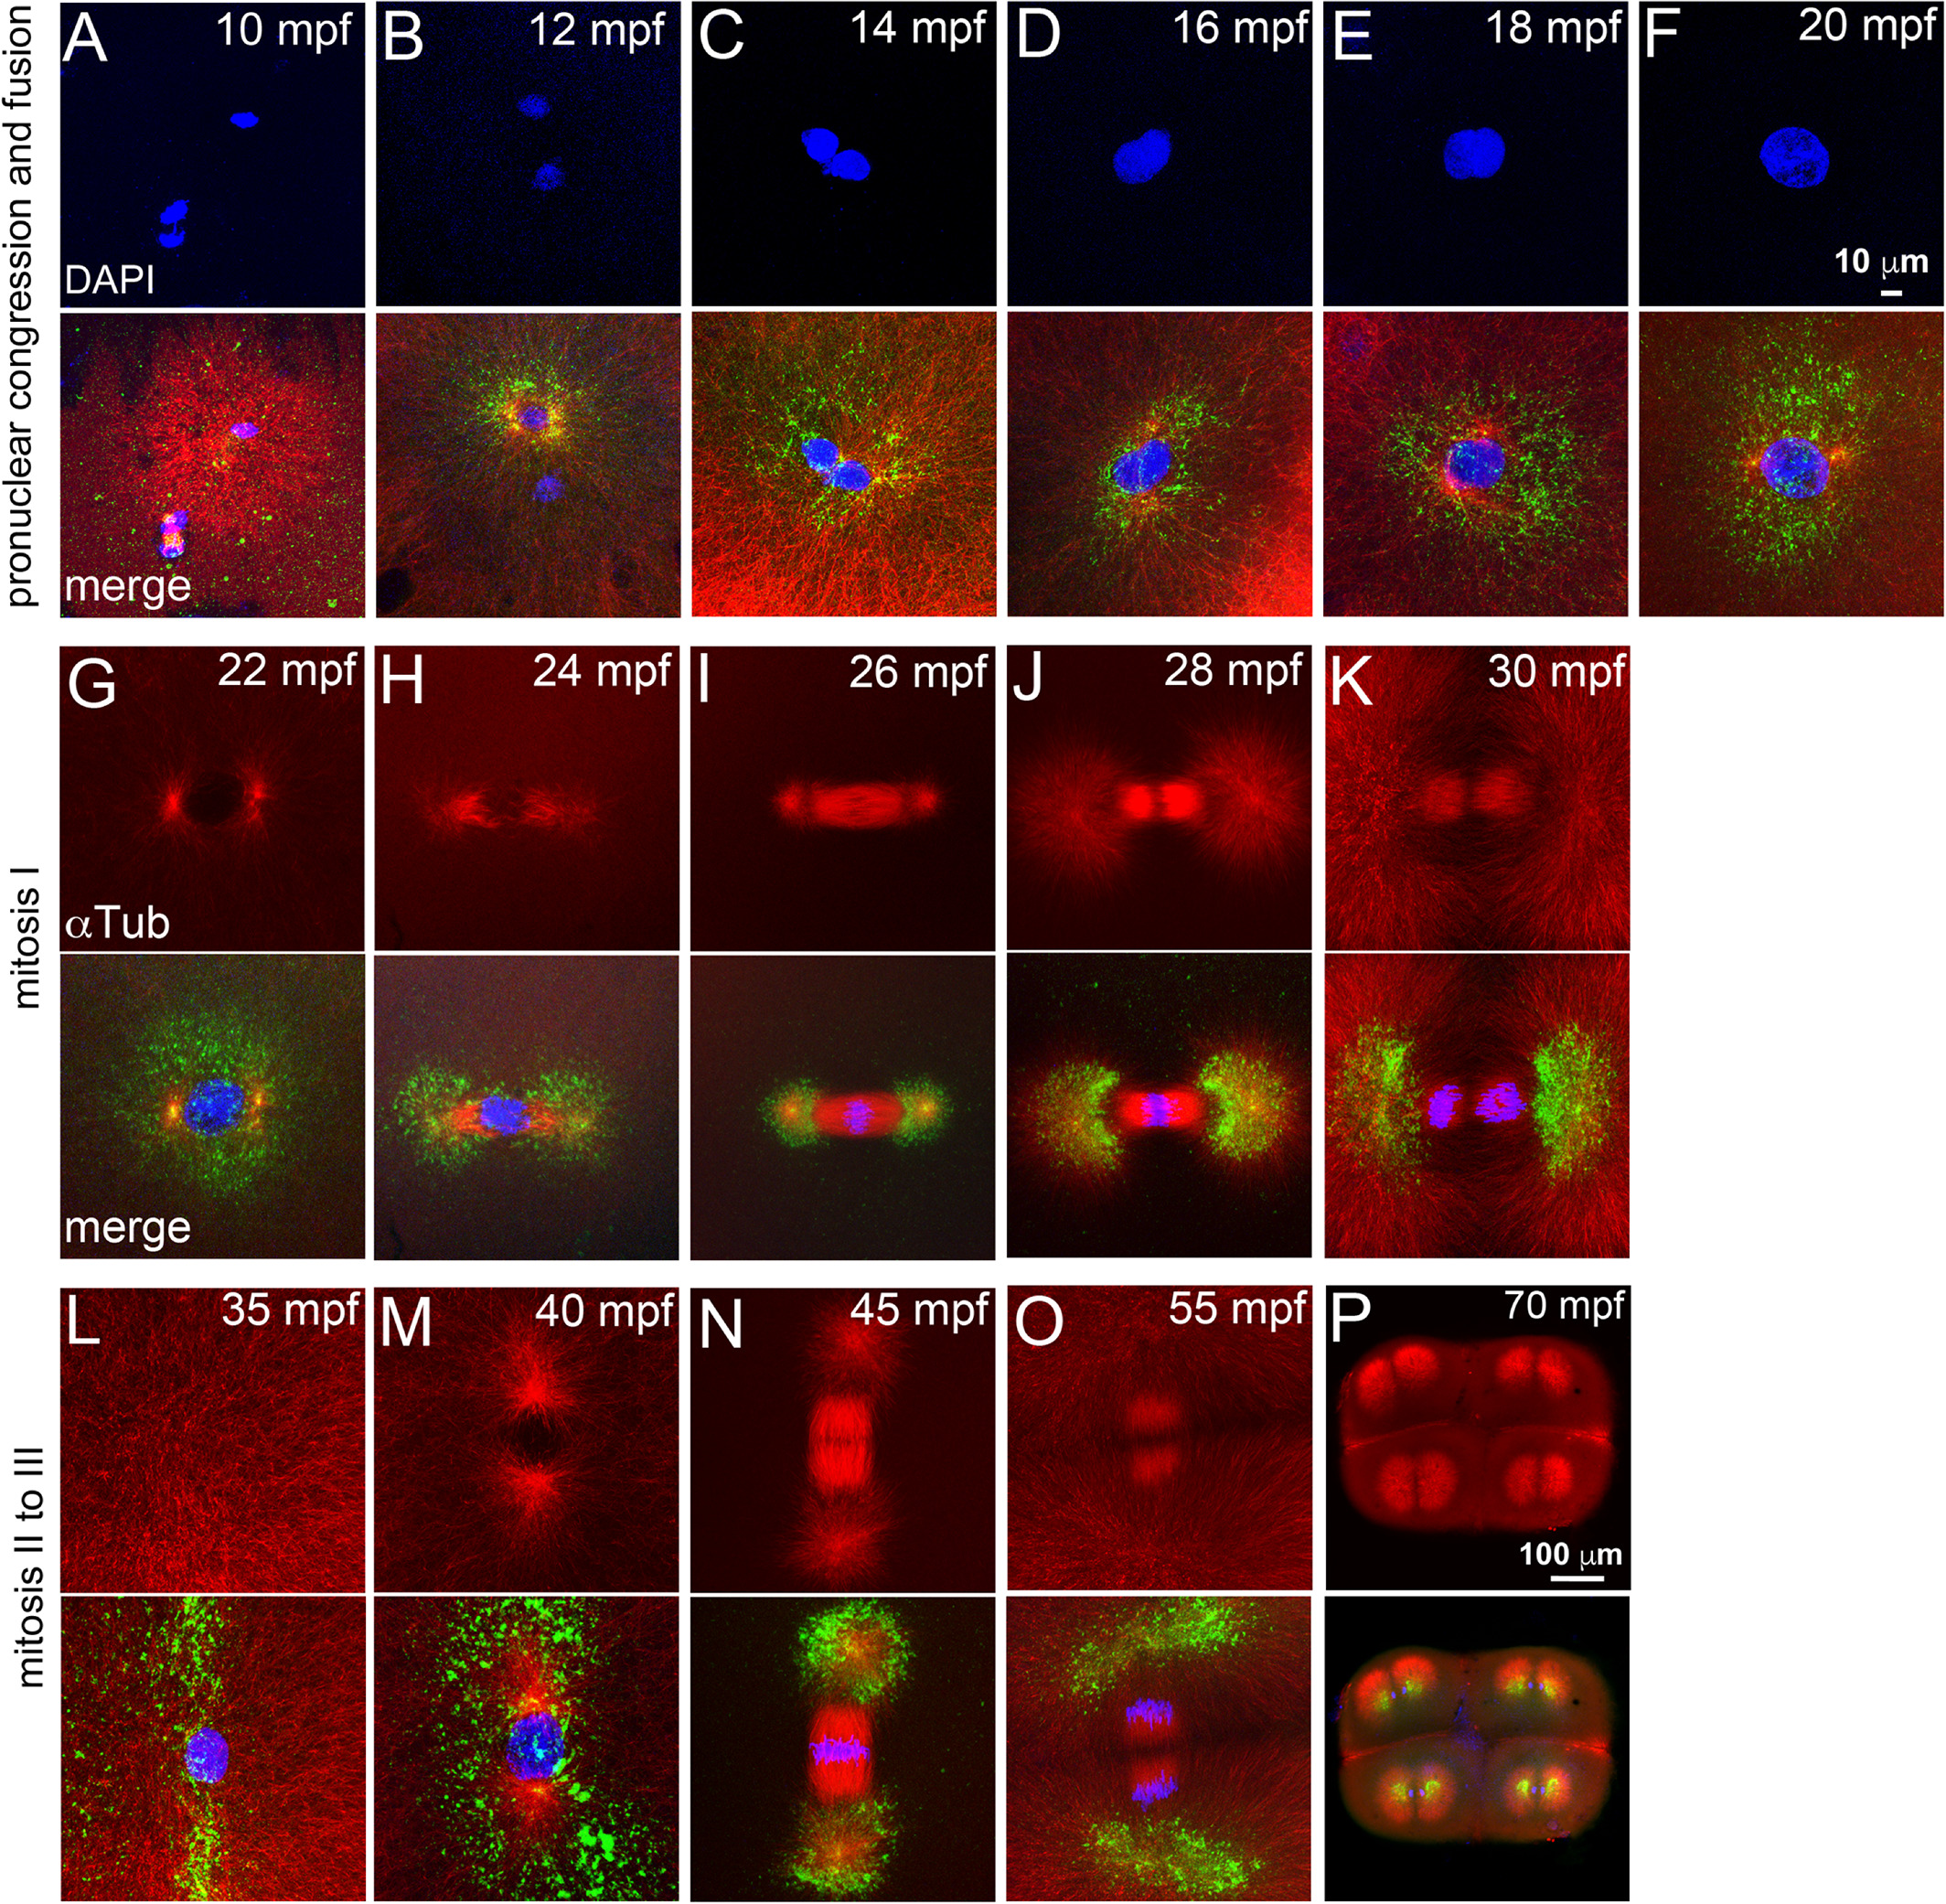
Fig. 3
The heat shocks occur during a phase of rapidly evolving cell biology immediately after fertilization. Immunofluorescence labeling of control embryos for DNA (DAPI, blue), α‐tubulin (red) and γ‐tubulin (green). A–F: Sperm aster nucleates a microtubule monoaster and the two pronuclei congress to fuse. G–L: Mitosis‐I with prophase‐I (G), prometaphase (H), metaphase‐I (I), early (J), late (K) anaphase‐I, and telophase‐I (L). M–P: Mitosis‐II with prophase‐II (M), metaphase‐II (N), and anaphase‐II (O). P: Mitosis‐III anaphase. In panels L–O, only one of the two cells is shown. Scale bar = 10 μm in F (applies to A–F); 100 μm in P (applies to G–P). Each panel is a representative image of 7 to 10 embryos imaged for a particular time point.